- WTI shows readiness to fill the week-start gap amid bearish MACD.
- 4H 200MA, near-term rising trend-line lend additional levels to watch.
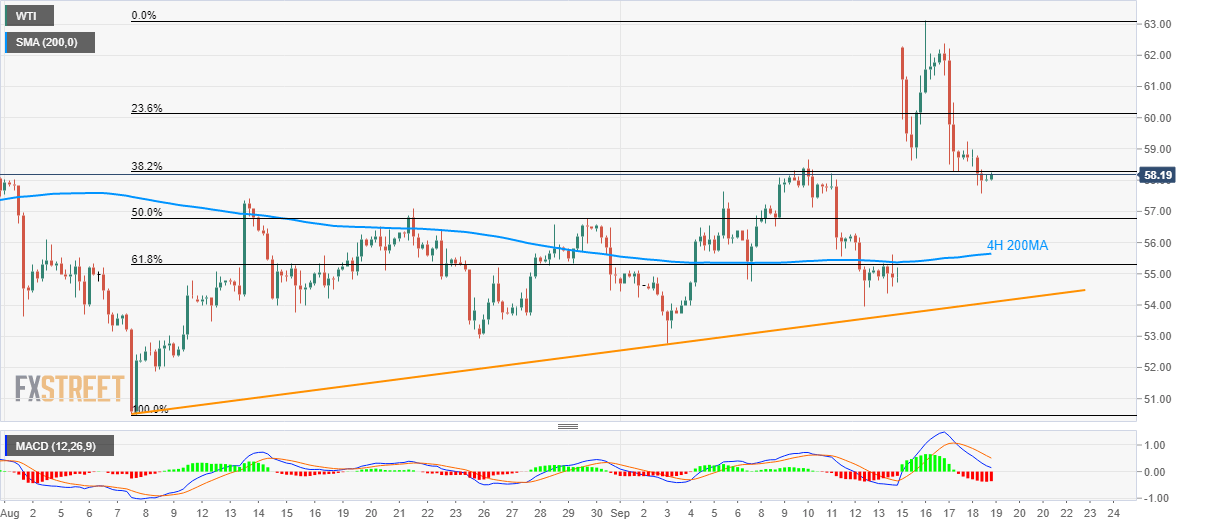
Following its declines below 38.2% Fibonacci retracement of August-September run-up, WTI trades near $58.20 during early Thursday.
With the bearish signal from the 21-bar moving average convergence and divergence (MACD) confirming the energy benchmark’s recent weakness, prices seem to fill the week-start gap.
In doing so, 50% Fibonacci retracement level of $56.80 can act as an intermediate halt prior to fetching the quote to 200-bar moving average on the four-hour chart (4H 200MA) level of $55.65.
Further, sellers may target 61.8% Fibonacci retracement level of $55.30 and a six-week-old rising trend-line, at $54.10 now, during additional south-run.
On the contrary, $58.70 and $60.00, nearing the 23.6% Fibonacci retracement, can keep buyers in check ahead of pushing them towards $62.30 and week’s top, also the four-month high, around $63.15.
WTI four-hour chart
Trend: pullback expected
