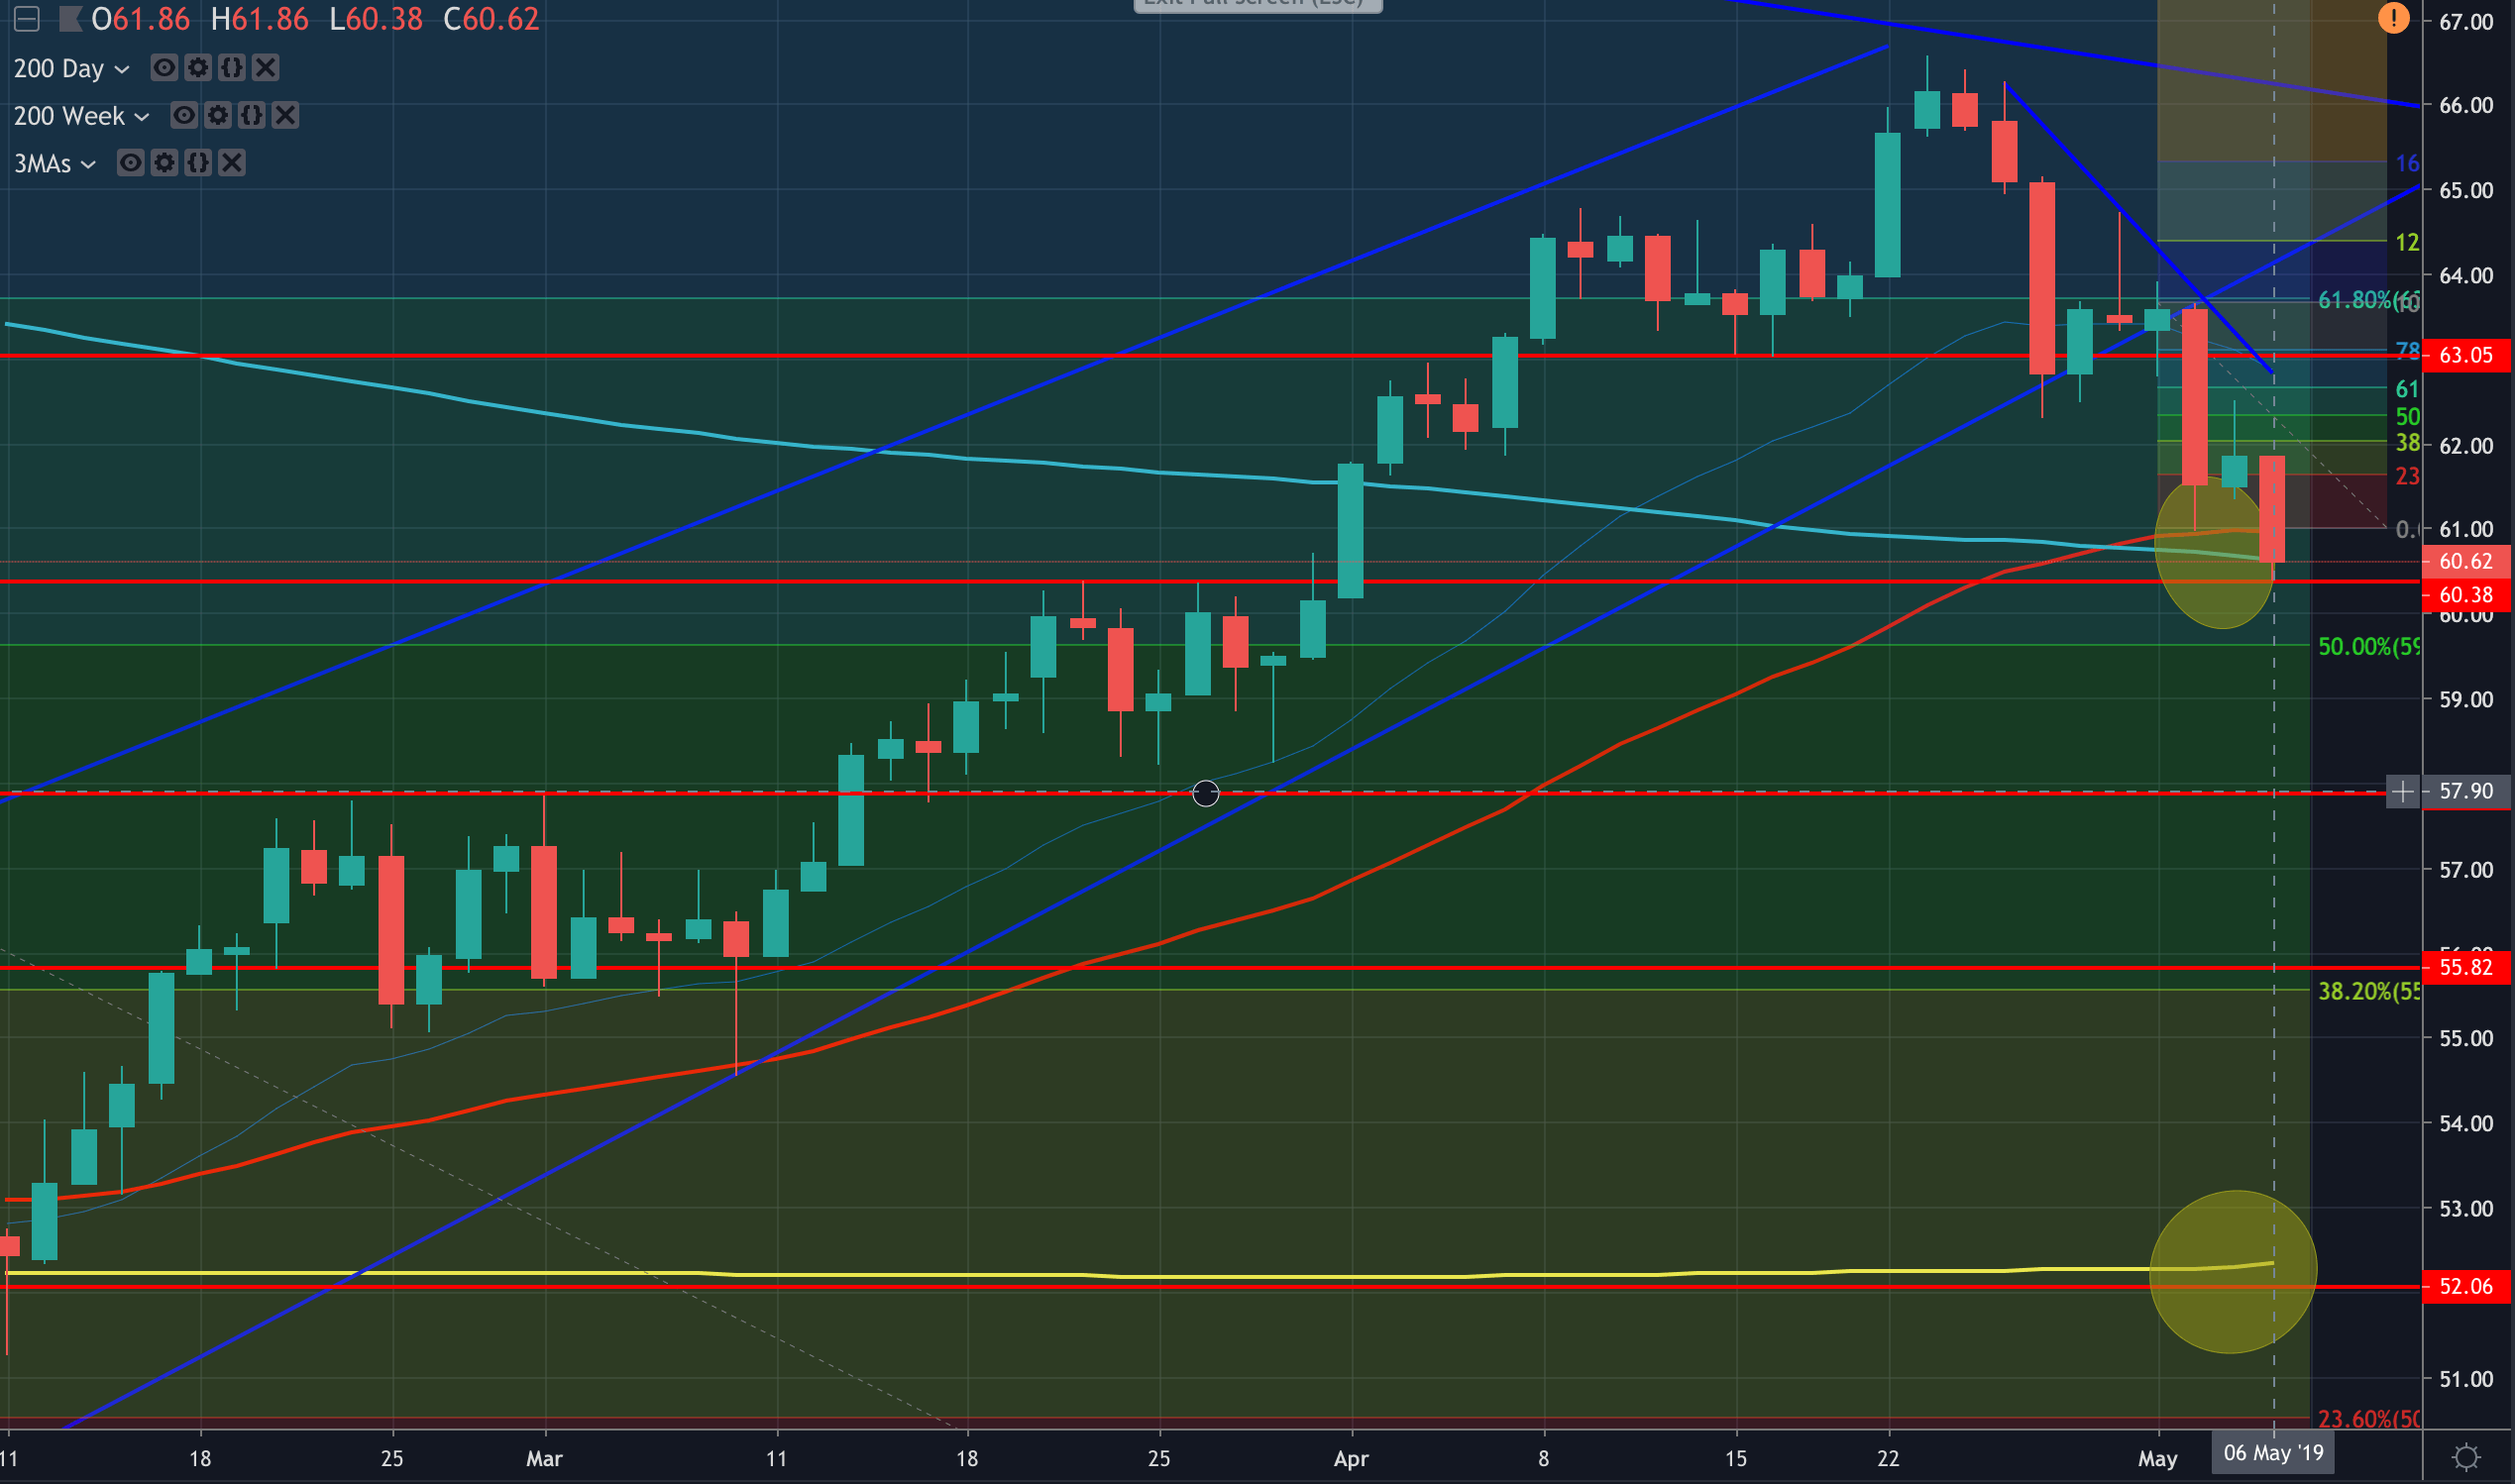
- WTI dropped at the start of the week following a risk-off start, (Breaking: Trump’s threat to lift tariffs on Chinese imports sends risk assets into reverse, Yen is 0.34% higher vs dollar).
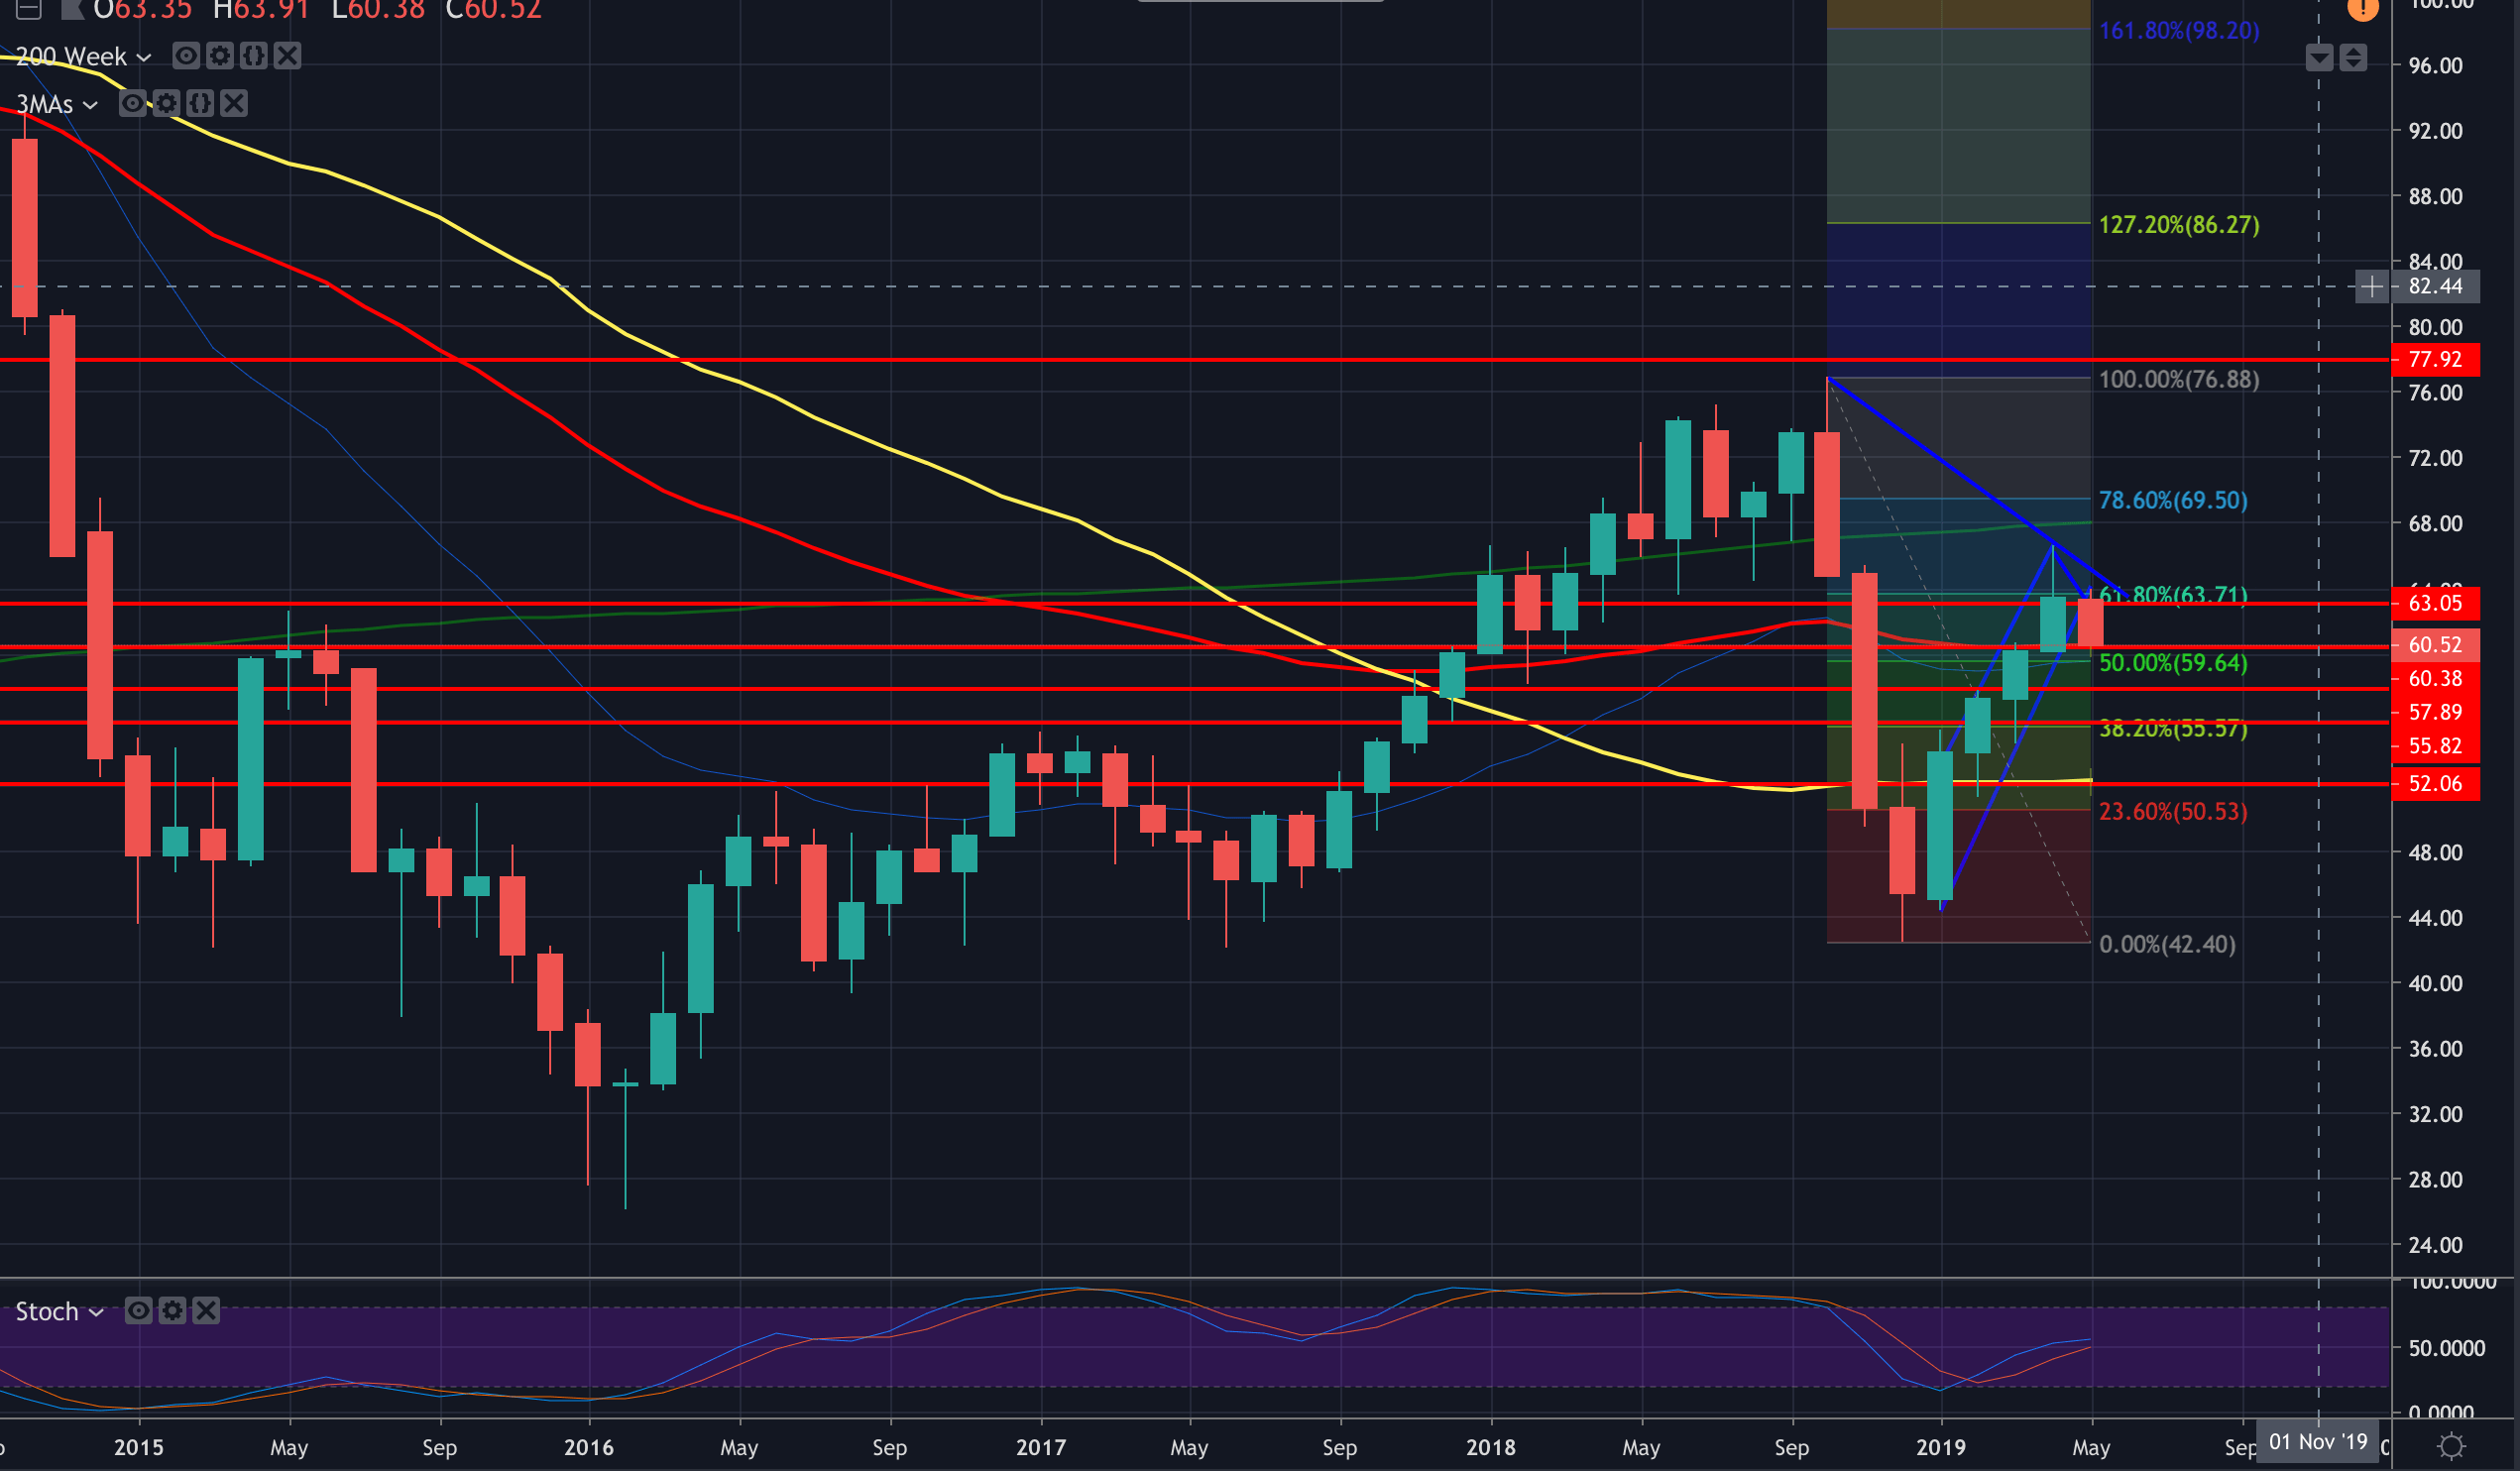
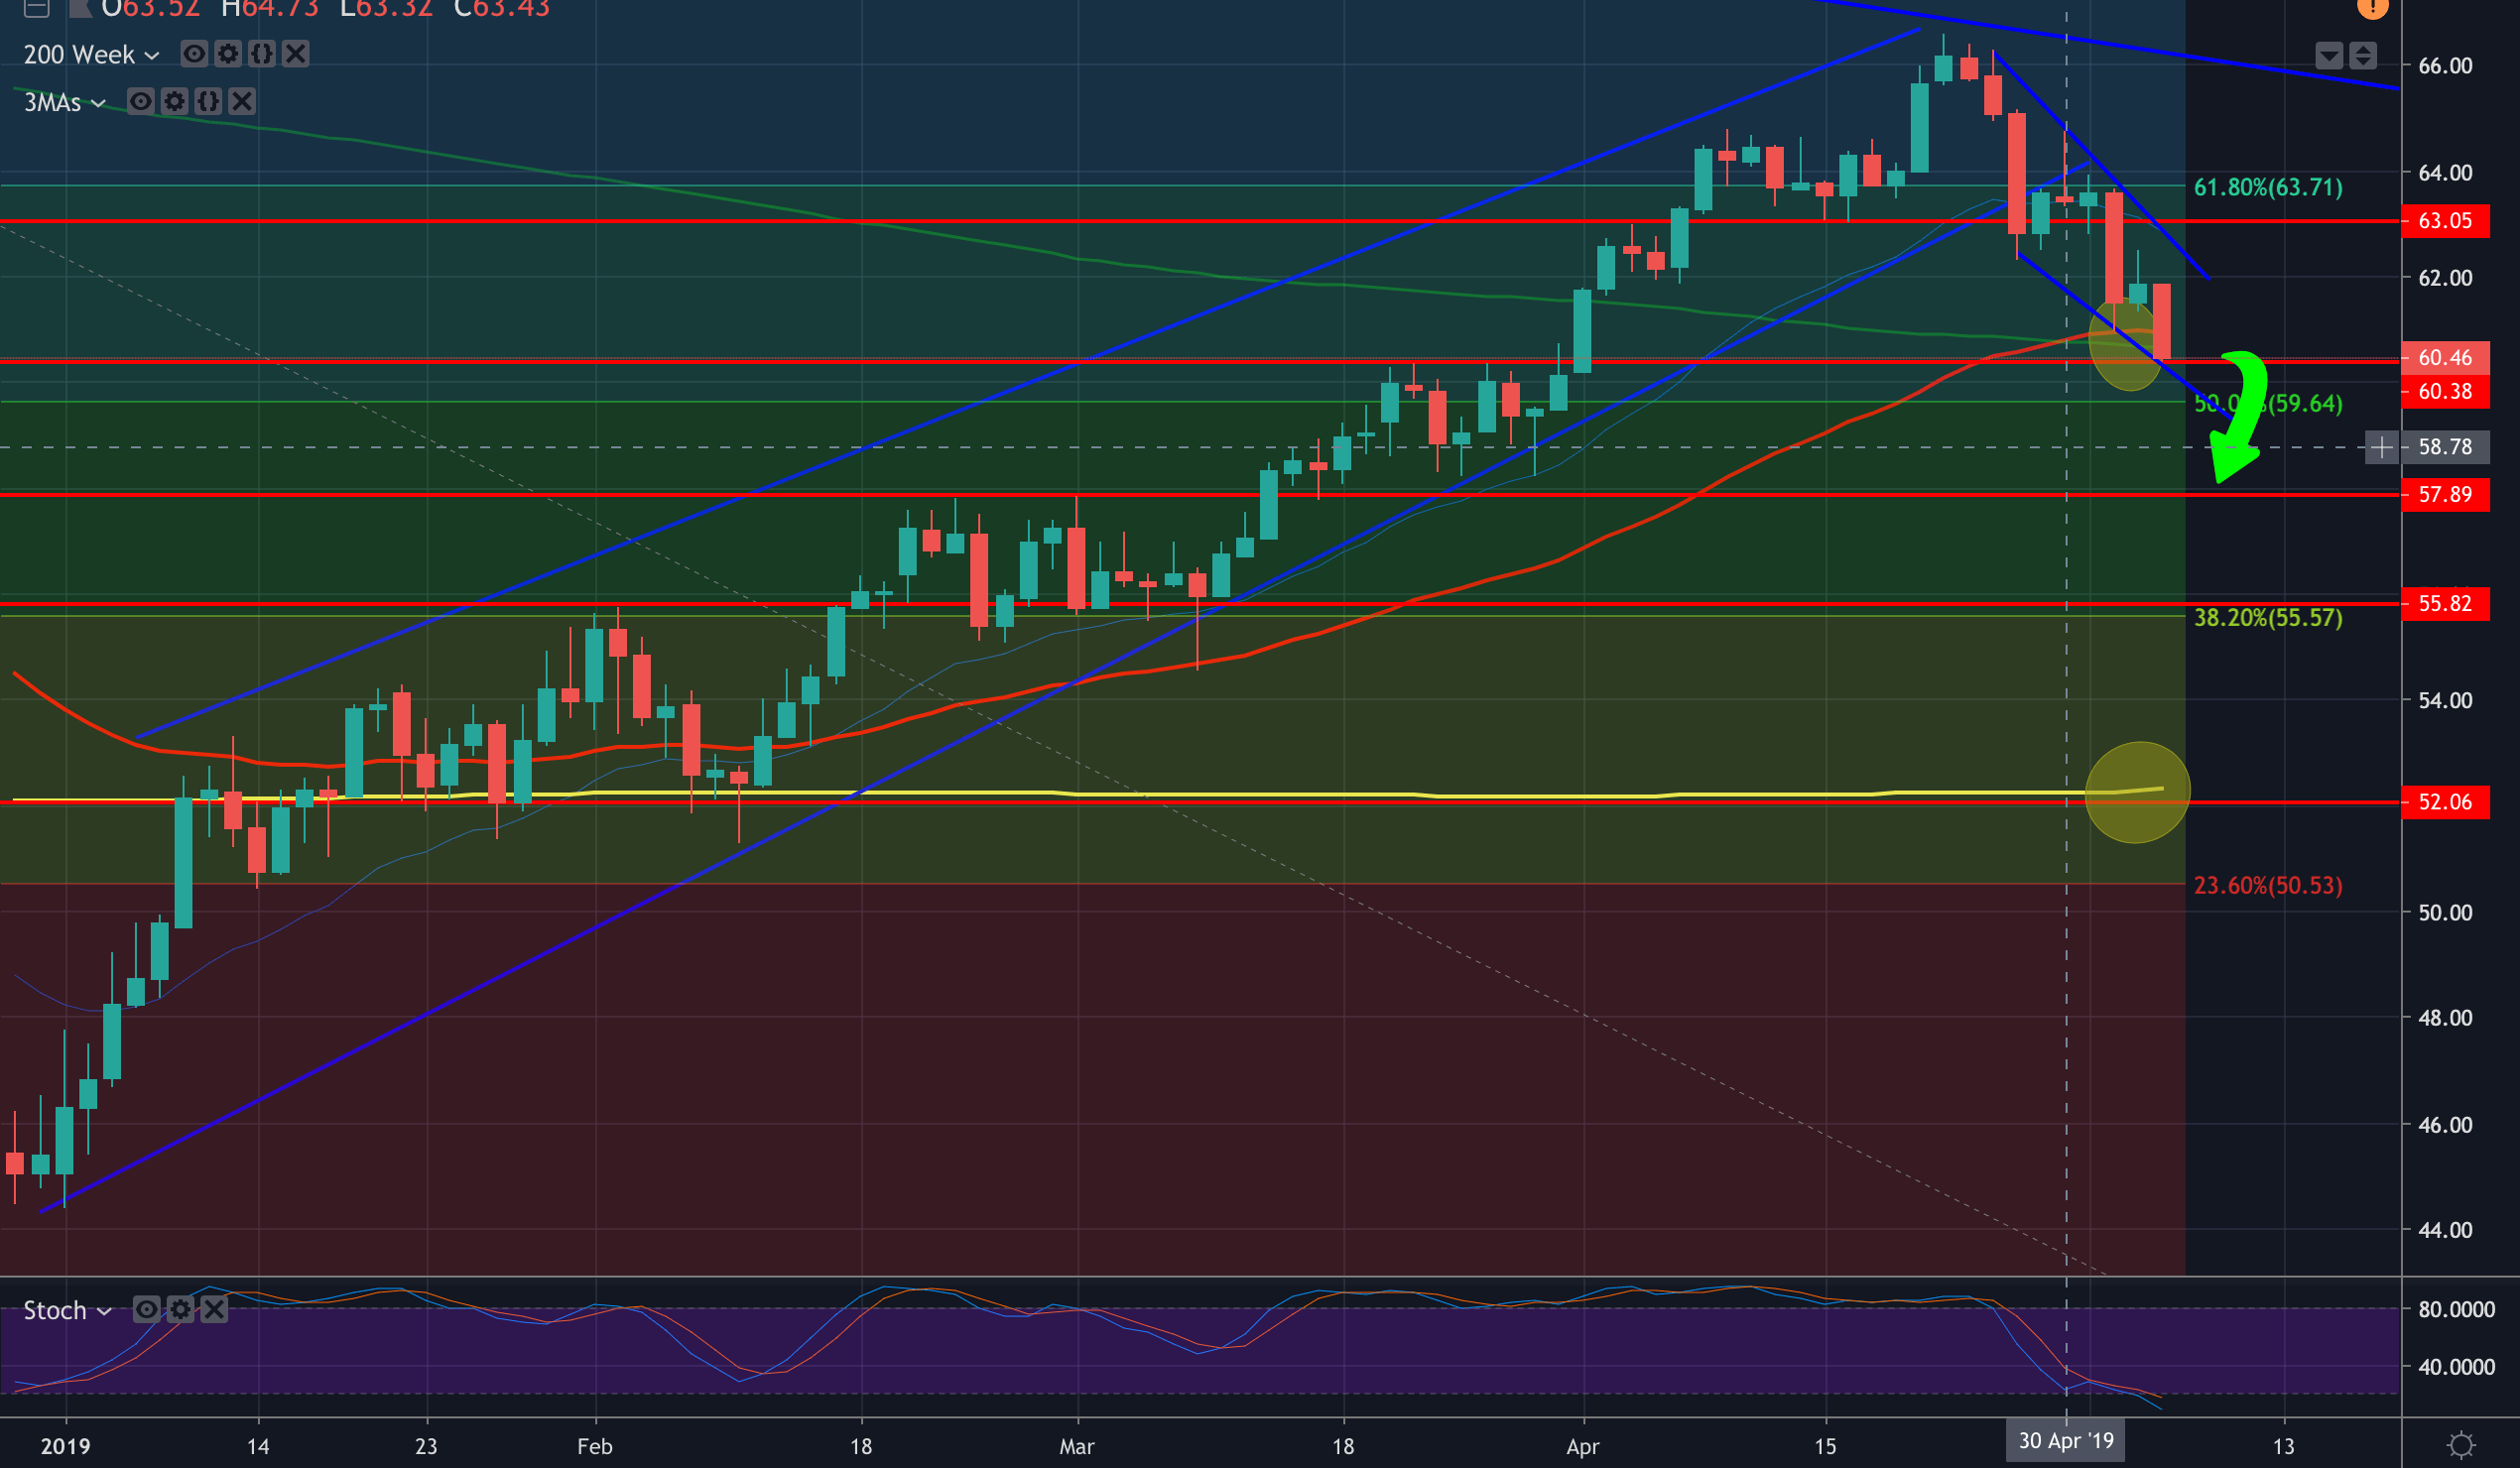
- The price has priced the 50 DMA crossing above the 200 DMA, Golden Cross, which might have been expected to be a strong level of support, jeopardising the prospects for a sustained bearish wedge continuation pattern breakout.
- Should the price continue to deteriorate below the Golden Cross, the price could drop by at least the height of the wedge (measured at the base where the two trendlines start) which is around $10.80 for a target of $52.00 (at weekly 200 MA/ 50 pips above Feb lows).
- However, the first target comes in at 57.89 although stochastics are no clearer either for determining where the price is heading; The monthly indicator leans bullish, weekly bearish and daily also leans bullish.
- The monthly stick alignment does offer a bearish scenario, with bearish shadow followed by a full bearish candle closing at the lows.
Daily WTI and Golden Cross
Daily downside target to 57.80s
WTI Weekly chart