- WTI registers modest changes after flashing the bearish candlestick formation on the chart.
- A three-week-old rising trend line can offer immediate support.
- The monthly resistance line will keep the black gold’s near-term upside capped.
WTI clings to $61.63 amid Tuesday’s Asian session. The oil benchmark recently posted a bearish candlestick formation, on the four-hour (4H) chart, near three month high.
Even so, prices are likely to get supported by the near-term ascending trend line, at $61.30 now, a break of which will confirm the bearish “rising wedge” chart pattern and could escalate the black gold’s declines.
In doing so, a 200-bar SMA level of $58.47 will be on the Bears’ radar. However, $60.00 and mid-December lows near $59.50 can offer intermediate halts during the downpour.
On the contrary, a break of the recent high surrounding $62.40 needs to overcome the monthly rising trend line, at $62.55, to aim for September month high near $63.15.
WTI four-hour chart
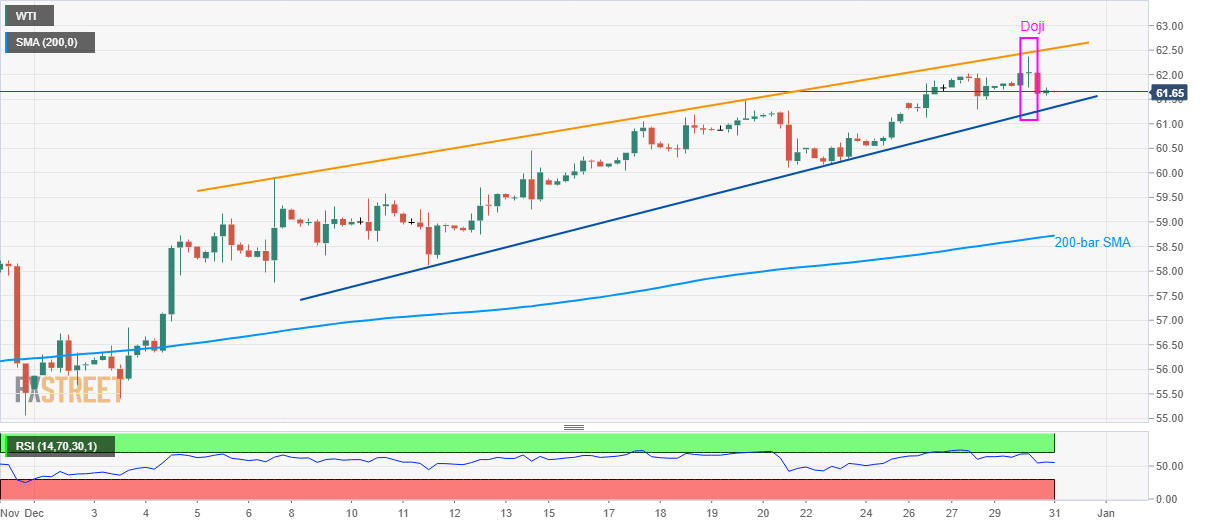
Trend: Pullback expected
