- WTI oil is looking north with falling channel breakout on the daily chart.
- A break above $56 could be seen during the day ahead.
WTI oil is currently trading at $55.50 per barrel, representing 0.40% losses on the day.
The decline, however, could be short-lived and prices could rise well above $56.00 during the day ahead, as the daily chart is reporting a falling channel breakout.
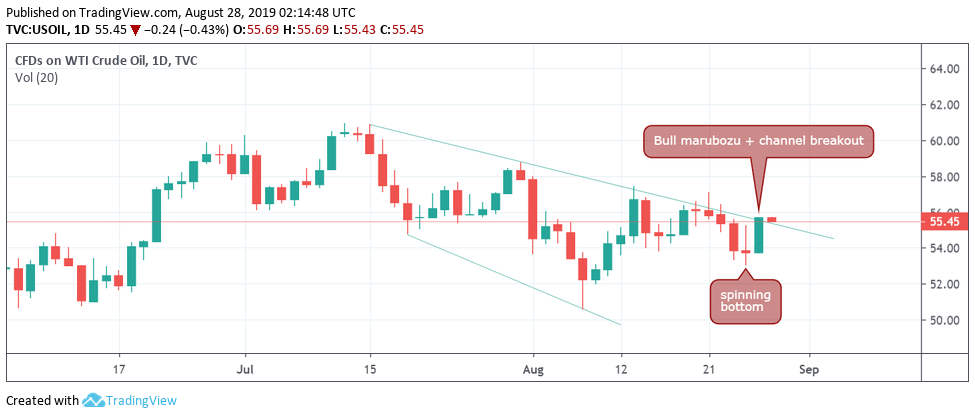
The black gold closed at $55.69 on Tuesday, confirming an upside break of a bearish channel represented by trendlines connecting the July 15 and July 31 highs and July 18 and Aug. 7 lows.
That channel breakout indicates the sell-off from the July 15 high of $60.89 has ended and the bulls have regained control.
Further, the black gold created a bullish marubozu candle on Tuesday, validating the spinning bottom candle (an early sign of bull reversal) created on Monday.
All-in-all, the path of least resistance is now to the higher side. The bullish case would weaken if black gold drops below Tuesday’s low of $53.71.
Daily chart
Trend: Bullish
Pivot points
