- WTI’s hourly chart is reporting an inverted flag breakdown.
- That bearish continuation pattern indicates an end of the corrective bounce from Thursday’s low of $53.58.
WTI oil is currently trading at $55.10 per barrel, having hit a high of $55.52 earlier today.
The pullback could be associated with the drop in China’s Yuan and the resulting risk aversion in the financial markets. At press time, the futures on the S&P 500 are down 1%.
The black gold could see a deeper drop during the day ahead, as the hourly chart is reporting a flag breakdown, a continuation pattern, which often accelerates the preceding bearish move.
The pattern has opened the doors to a retest of the recent low of $53.58. On the lower, prices may find support at a higher low of $54.67 created on Friday.
The bearish case would be invalidated if prices break above $55.50, which looks unlikely.
Hourly chart
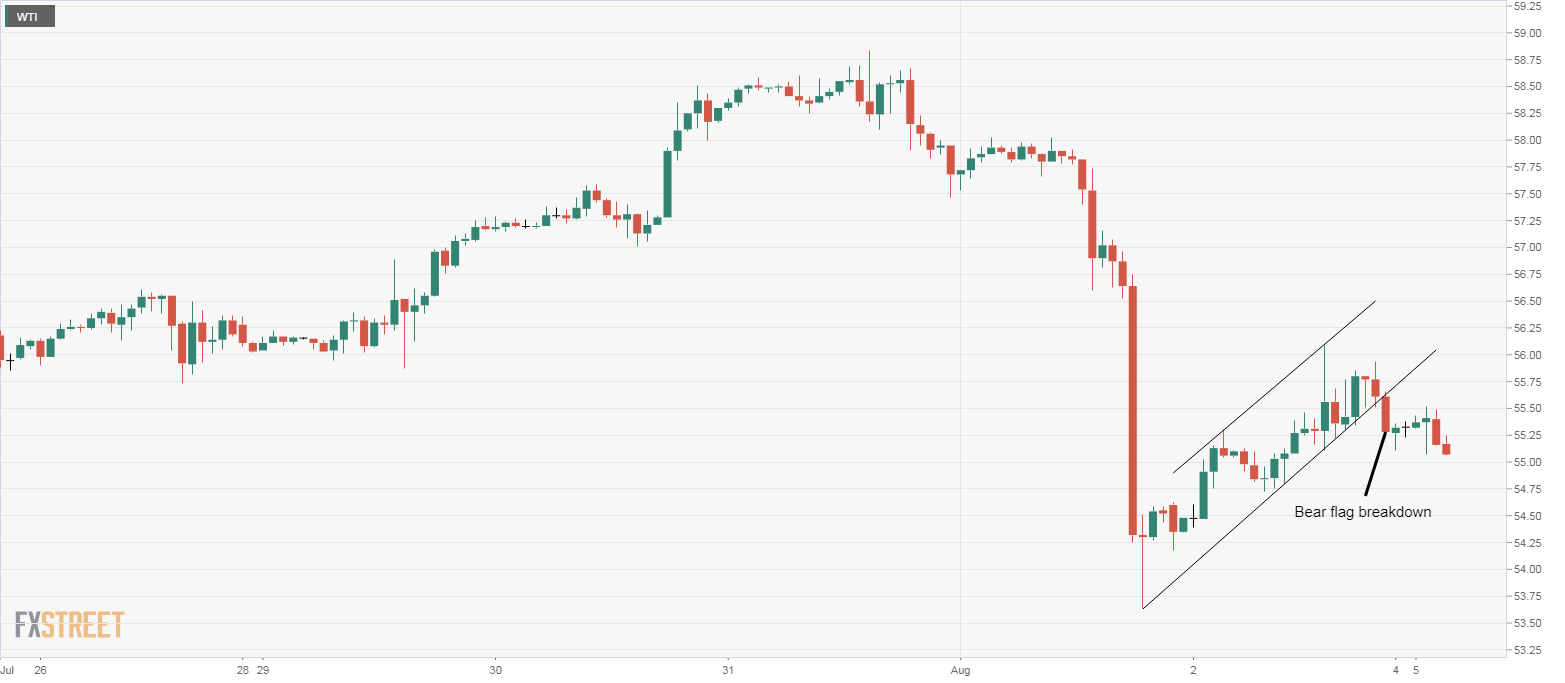
Trend: Bearish
Pivot points
