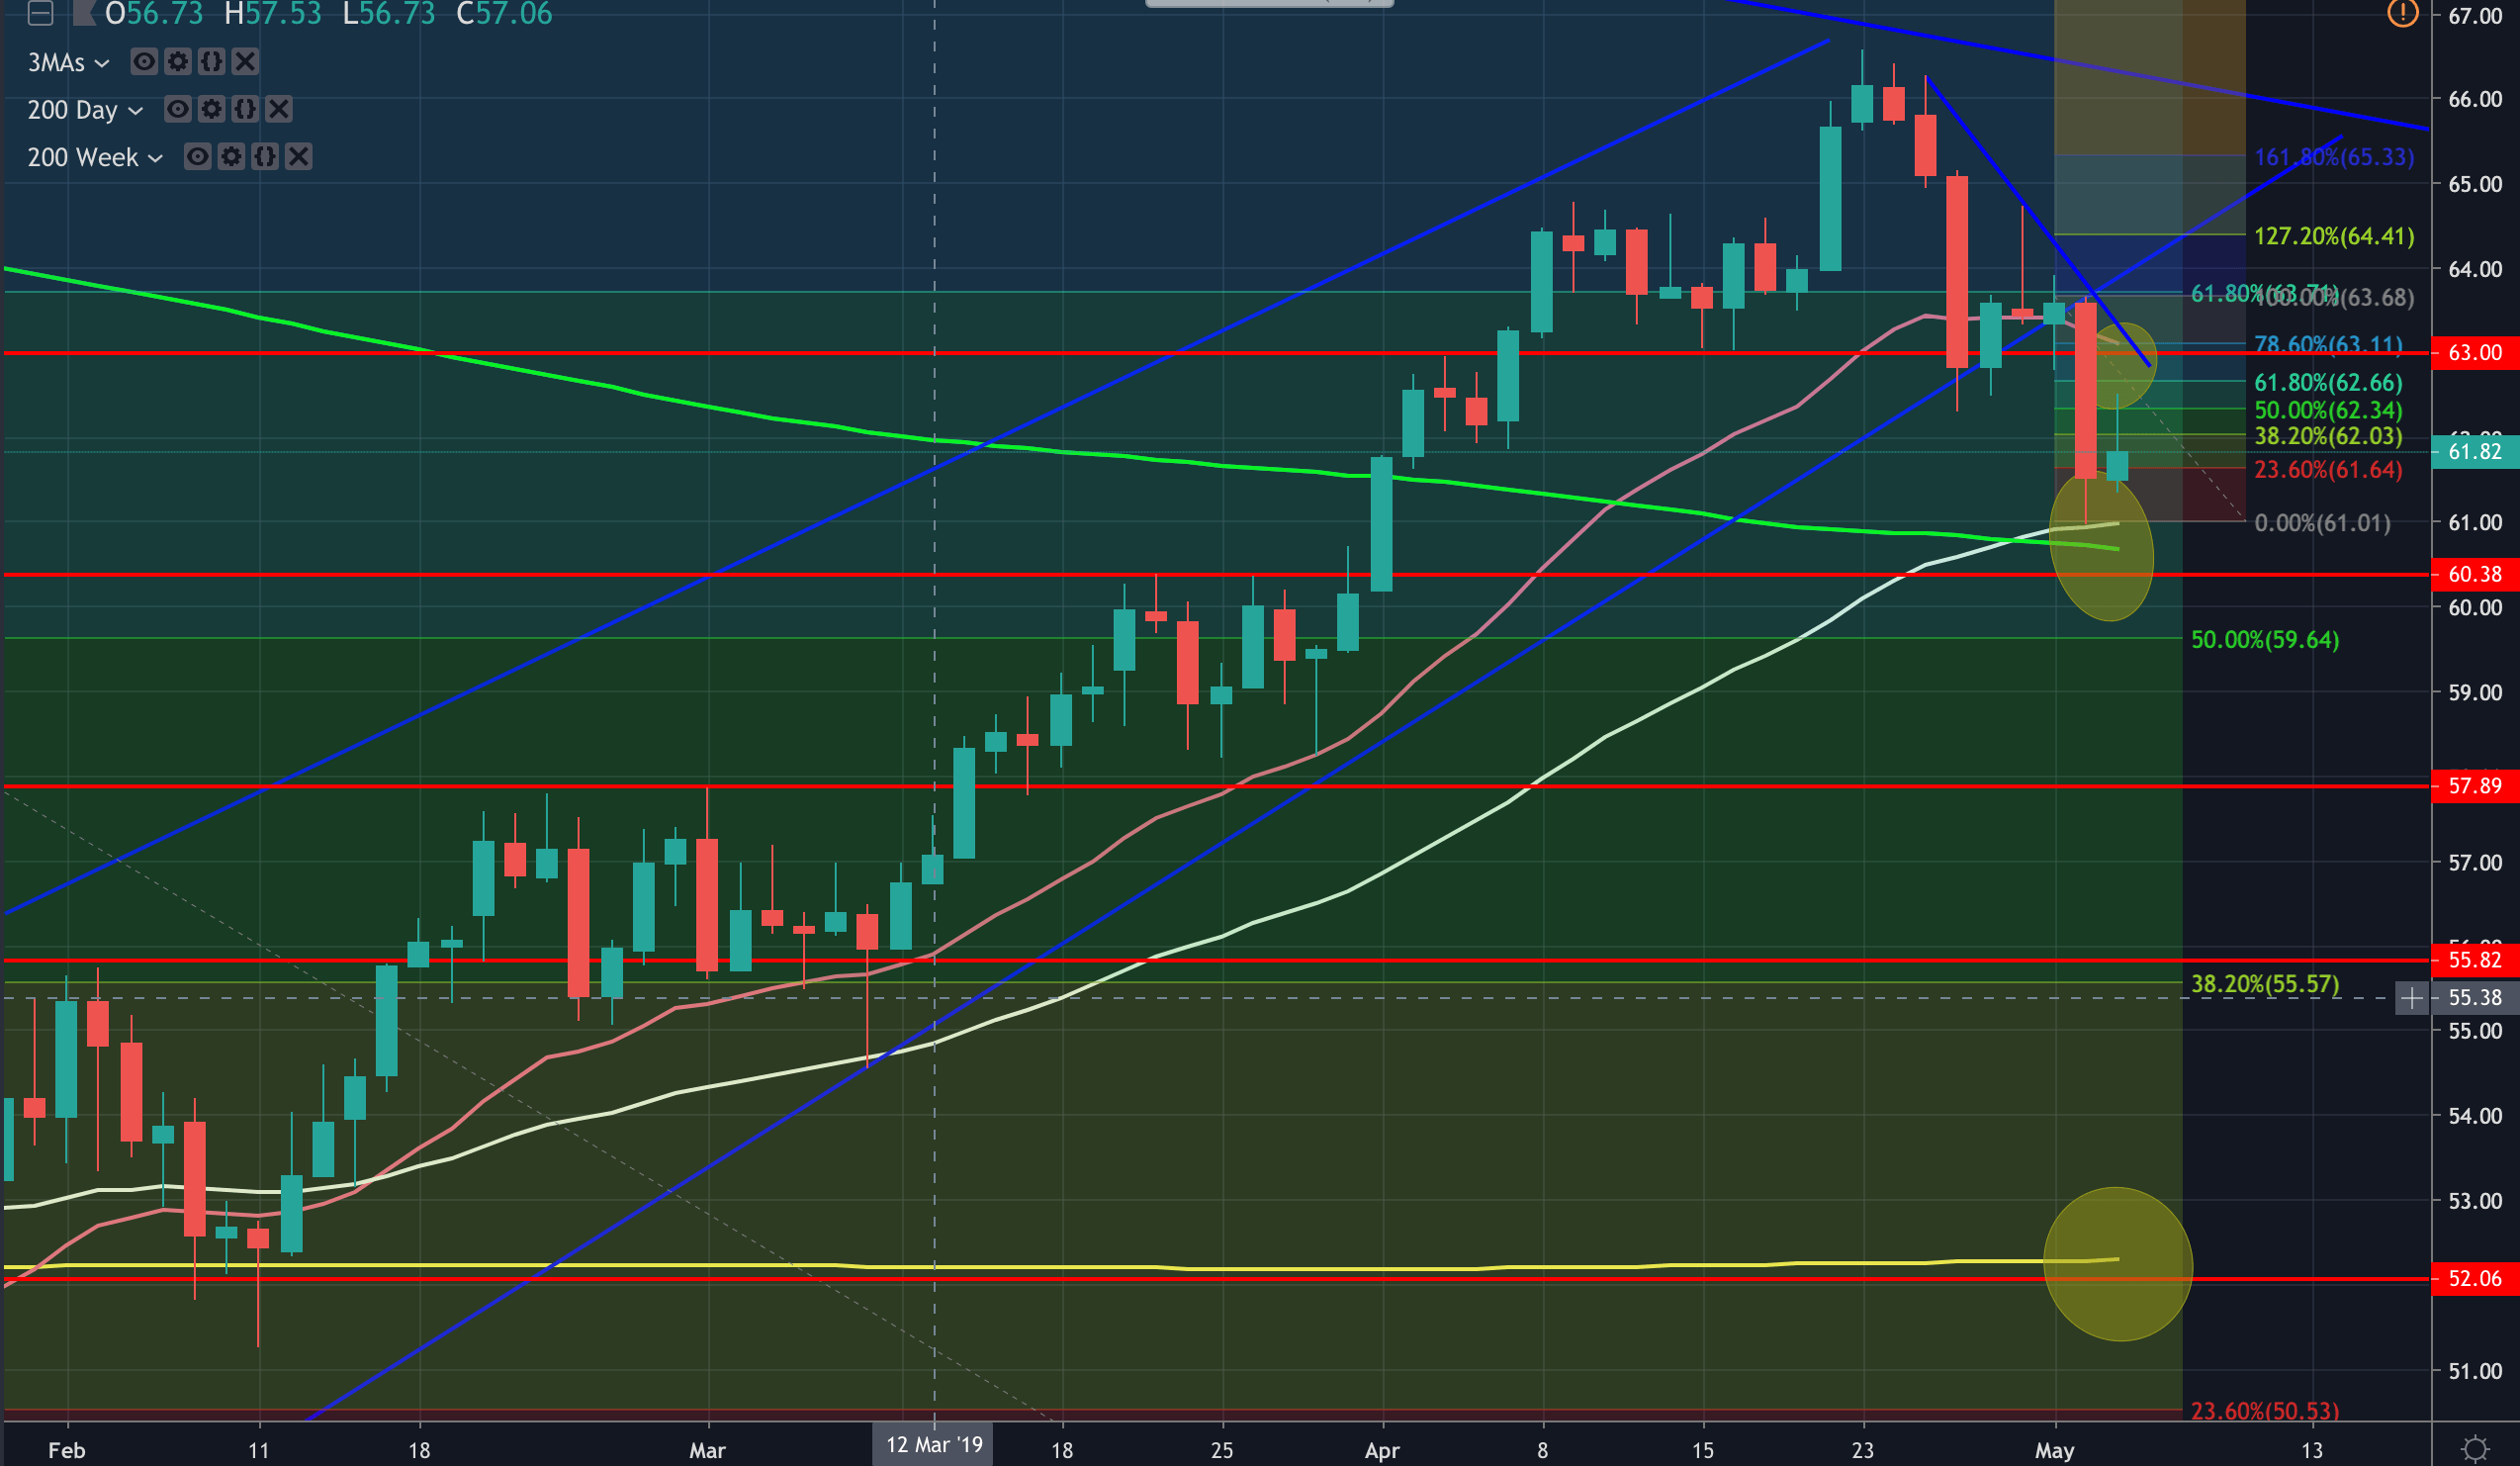
- As per the analysis yesterday, WTI indeed made a mean reversion to the 50% retracement of the move and a little beyond the 62.30s.
- However, this has offered a discount for the bears although there is further upside towards the 78.6% retracement and the confluence of the 20-DMA and interim bear channel resistance as displayed in an eclipse on the chart below. This falls in at 63 the figure or thereabouts.
- However, the golden cross scenario, with the 50 DMA crossing above the 200 DMA is a concerning factor and has acted as a strong level of support, also highlighted below in an eclipse.
Bearish wedge continuation pattern breakout
- The rising wedge is a bearish continuation pattern and wedges can be significant turning points. In this case, a break and continuation of the bear trend would target below the $42 handle and late Dec lows – (Wedge breakouts can see the price run in the breakout direction for long periods of time).
- The price could drop by at least the height of the wedge (measured at the base where the two trendlines start) which is around $10.80 for a target of $52.00 (at weekly 200 MA/ 50 pips above Feb lows).