- WTI’s recovery from two-month lows could be short-lived.
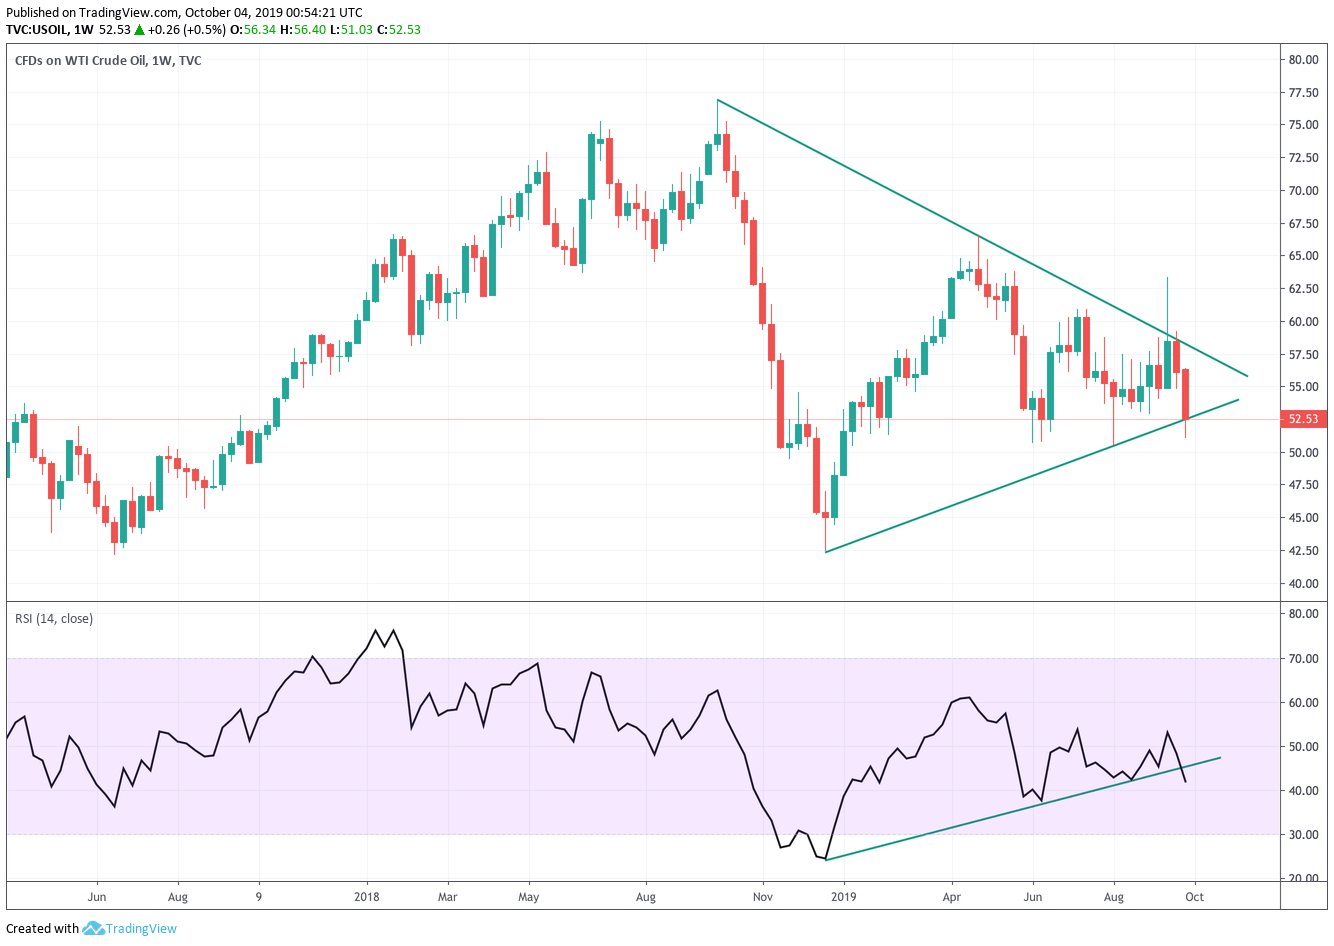
- Oil is teasing a contracting triangle breakdown on the weekly chart.
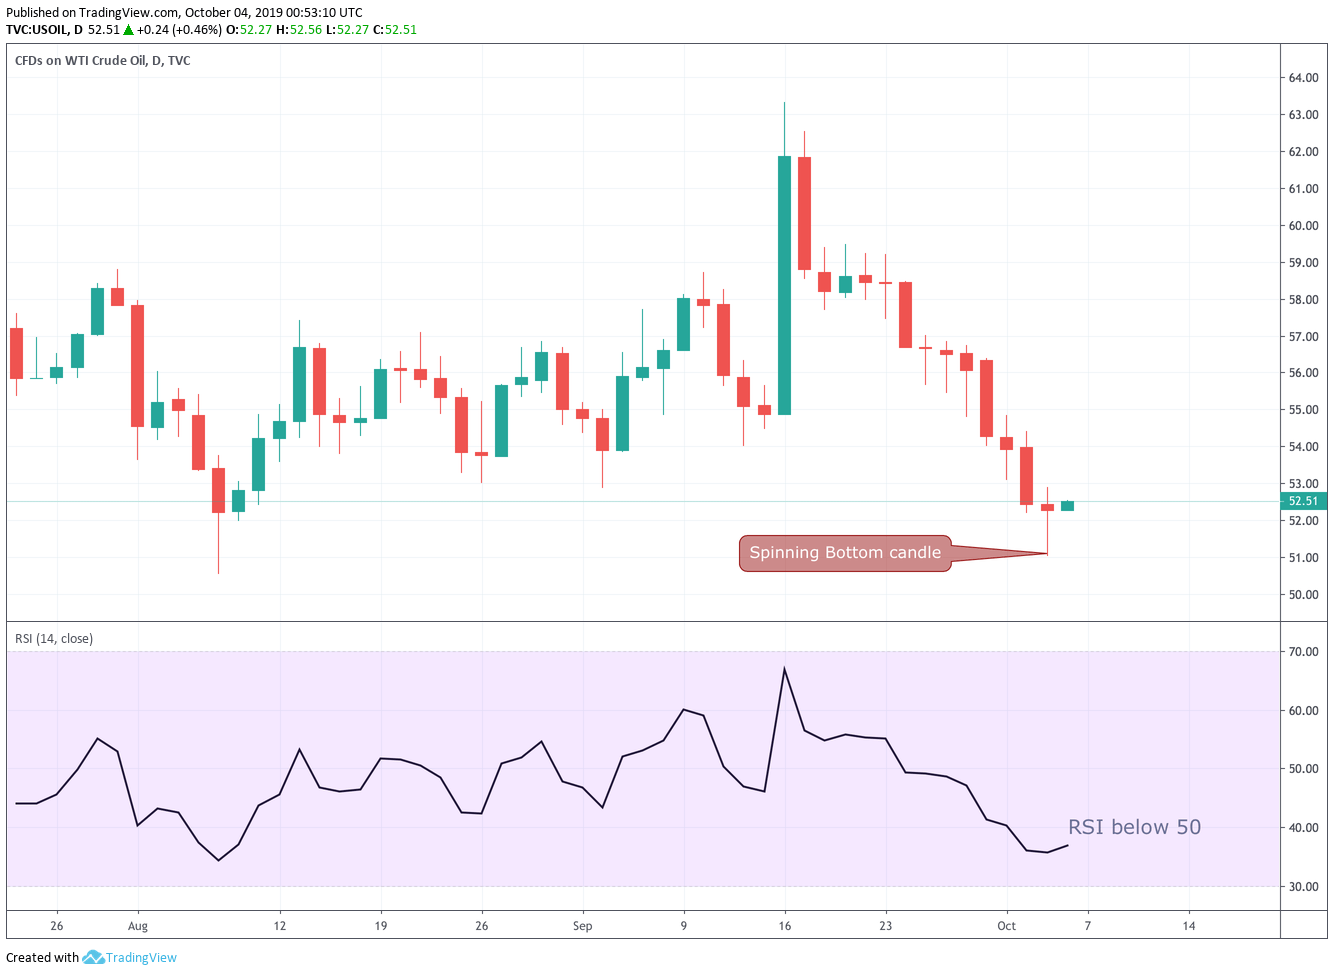
WTI oil is currently trading at $52.58 per barrel, having hit a low of $51.03 on Thursday. That was the lowest level since Aug. 7.
The recovery has taken the shape of a “spinning bottom” candle on the daily chart. That candle has appeared after a notable price drop and could be considered a sign of seller exhaustion.
A bullish reversal would be confirmed if prices close above the spinning bottom’s high of $52.91 on Friday. A bullish close, however, looks unlikely, as the daily chart indicators are biased bearish.
For instance, the 14-day relative strength index (RSI) is reporting a below-50 print. The 5- and 10-day moving averages are trending south and the former support-turned-resistance of $52.87 is still intact.
Weekly close pivotal
WTI is teasing a contracting triangle breakdown on the weekly chart.
A close below the lower edge of the contracting triangle, currently at $52.87, would confirm a breakdown would shift risk in favor of a drop below key support at $50.49 – trendline connecting June 3 and Aug. 5 lows.
Daily chart
Weekly chart
Trend: Bearish
Technical levels
