- WTI recovers from 23.6% Fibonacci retracement of July-August declines.
- Oversold RSI conditions favor pullback to 38.2% Fibonacci retracement, 4H 100MA.
While the escalating trade war between the US and China dragged WTI to early-month lows at the start of the week’s trading, the black gold bounces off 23.6% Fibonacci retracement level as trading near $53.40 by the press time of initial Monday in Asia.
In addition to 23.6% Fibonacci retracement level, oversold conditions of 14-bar relative strength index (RSI) also favor the pair’s further recovery to 38.2% Fibonacci retracement level of $54.51 and then a follow-on rise to 100-bar moving average on the four-hour chart (4H 100MA) at $54.75.
Should prices remain strong beyond $54.75, 50% and 61.8% Fibonacci retracement levels of $55.75 and $57.00 could please buyers ahead of challenging them with August 13 high close to $57.40.
On the downside break of $52.98 comprising 23.6% Fibonacci retracement, the energy benchmark could quickly slip to August 08 low of $51.87 whereas monthly bottom surrounding $50.50 and $50.00 round-figure will challenge bears then after.
WTI 4-hour chart
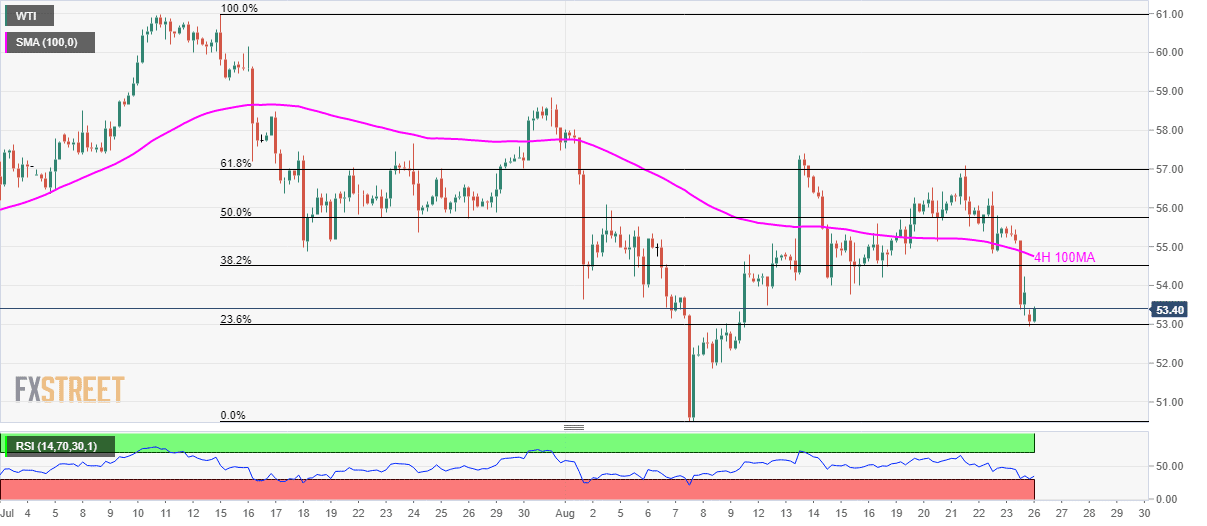
Trend: Pullback expected
