- WTI fails to hold strength after flashing monthly high.
- 200-bar SMA offers immediate support ahead of 50% Fibonacci retracement and early-month high.
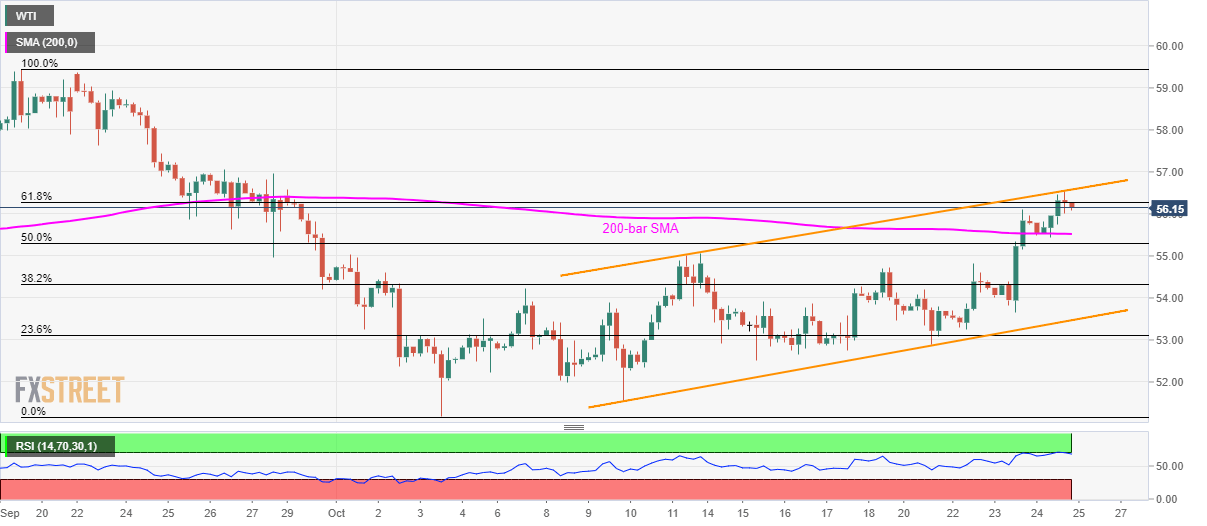
With a two-week-old rising channel dragging WTI back from monthly tops, the energy benchmark trades around $56.15 during the early hours of Friday’s Asian session.
In addition to the black gold’s U-turn from short-term channel’s resistance line, its declines below 61.8% Fibonacci retracement of late-September to early-October month declines and overbought conditions of 14-bar Relative Strength Index (RSI) also favor sellers.
That said, 200-bar Simple Moving Average (SMA) level of $55.52 and 50% Fibonacci retracement of $55.30 could act as immediate supports ahead of early-month high around $55.00.
In a case of the quote’s further south-run below $55.00, the channel’s lower-line near $53.50 becomes the key to watch.
On the upside, price rally beyond channel resistance of $56.60 could aim for $57.10 and $57.70 whereas September 19 high near $59.50 will be on bull’s radar afterward.
WTI 4-hour chart
Trend: pullback expected
