- WTI advances to the fresh high since September 17.
- A two-week-old rising trend channel favors further upside ahead of the pattern’s resistance.
- 100-bar SMA, November month highs seem to lure bears on the downside break of the channel.
WTI follows a short-term bullish chart formation while rising to $61.88 during early Friday. In doing so, the black gold ignores the overbought conditions of the 14-bar Relative Strength Index (RSI).
During the energy benchmark’s sustained rise, the resistance line of the fortnight-old ascending trend channel, at $62.60, can entertain the Bulls ahead of the September month high near $63.13.
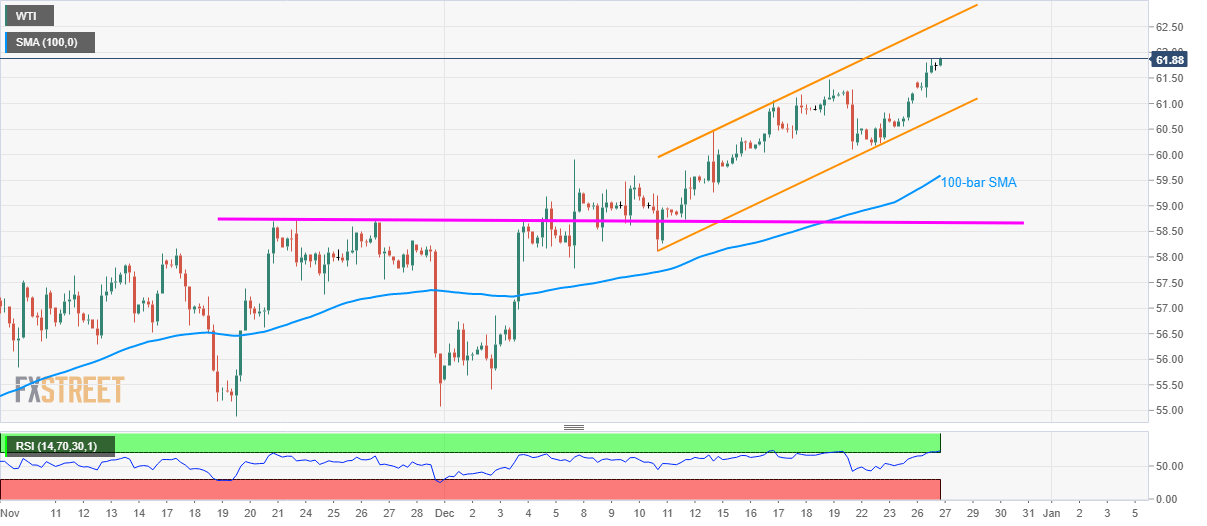
Should traders book profits from the multi-month top, the channel’s support near $60.75 becomes the key as a downside break of the same will highlight a 100-bar Simple Moving Average (SMA) level of $59.60.
If at all bears’ fail to bounce off 100-bar SMA, November month top surrounding $58.70 will return to the chart.
WTI four-hour chart
Trend: Bullish
