- WTI fails to hold strength around monthly high.
- October 01, 11 tops gain intra-day sellers’ attention.
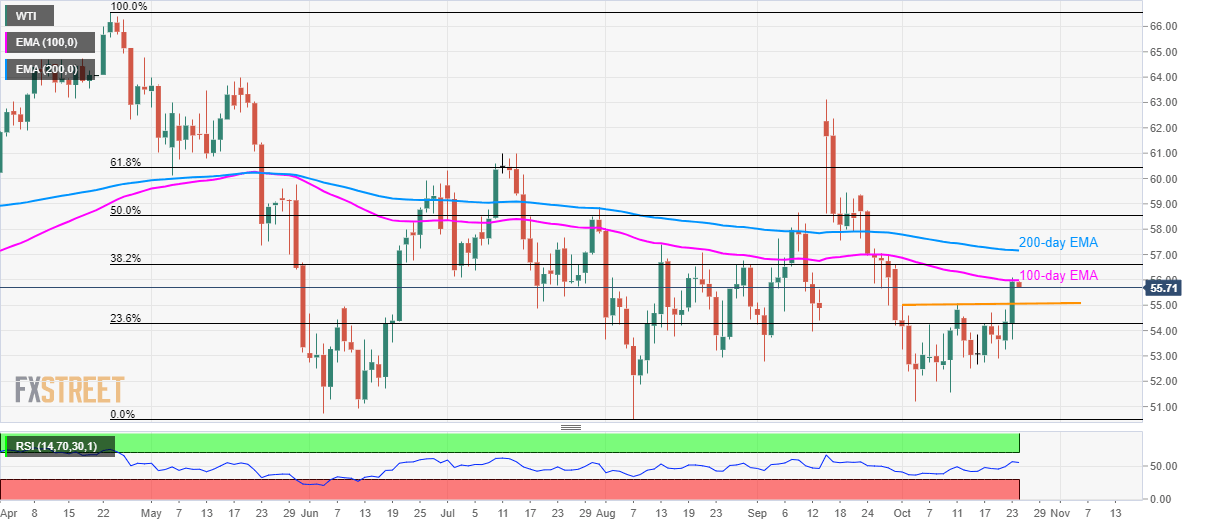
- 38.2% Fibonacci retracement, 200-day EMA add to the resistance.
With its failure to rise past-100-day Exponential Moving Average (EMA), WTI declines to $55.75 by the press time of early Thursday.
The energy benchmark now aims at the early-month highs surrounding $55.00 whereas 23.6% Fibonacci retracement of April-August declines, at $54.27, could please bears afterward.
In a case where prices keep trading southwards below $54.27, $52.50 and a monthly low of $51.20 will be in the spotlight.
On the flip side, a sustained break above 100-day EMA level of $56.00 could challenge 38.2% Fibonacci retracement level of $56.60 prior to rising towards $57.20 number that signifies 200-day EMA.
WTI daily chart
Trend: pullback expected
