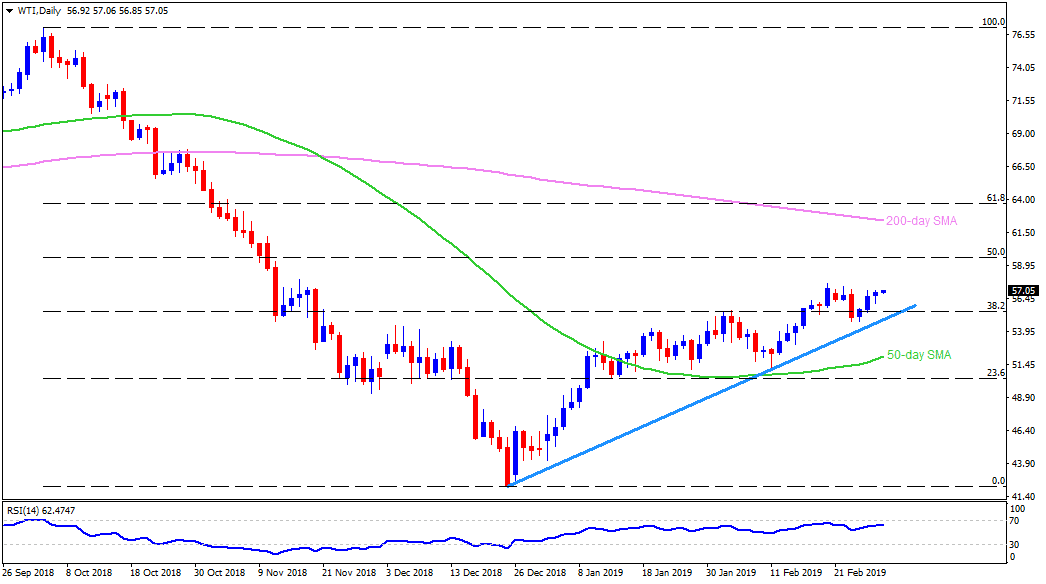
WTI daily chart
- WTI is taking the bids around $57.00 during early Asian sessions on Friday.
- In spite of being on recovery mode during the fourth consecutive day, the energy benchmark needs to cross the early-month reversal point of $57.90 in order to aim for $58.20 comprising November 16 high.
- Should there be additional upside past-$58.20, $59.00 and $60.00 round-figure may gain Bulls’ attention.
- Meanwhile, $56.50 and 38.2% Fibonacci Retracement of its October – December 2018 downturn, at $55.75 may please sellers ahead of diverting their attention to an upward sloping trend-line stretched since late-December, at $55.00.
- In case prices continued declining under $55.00, 50-day simple moving average (SMA) of $52.30 can become Bears’ favorite.
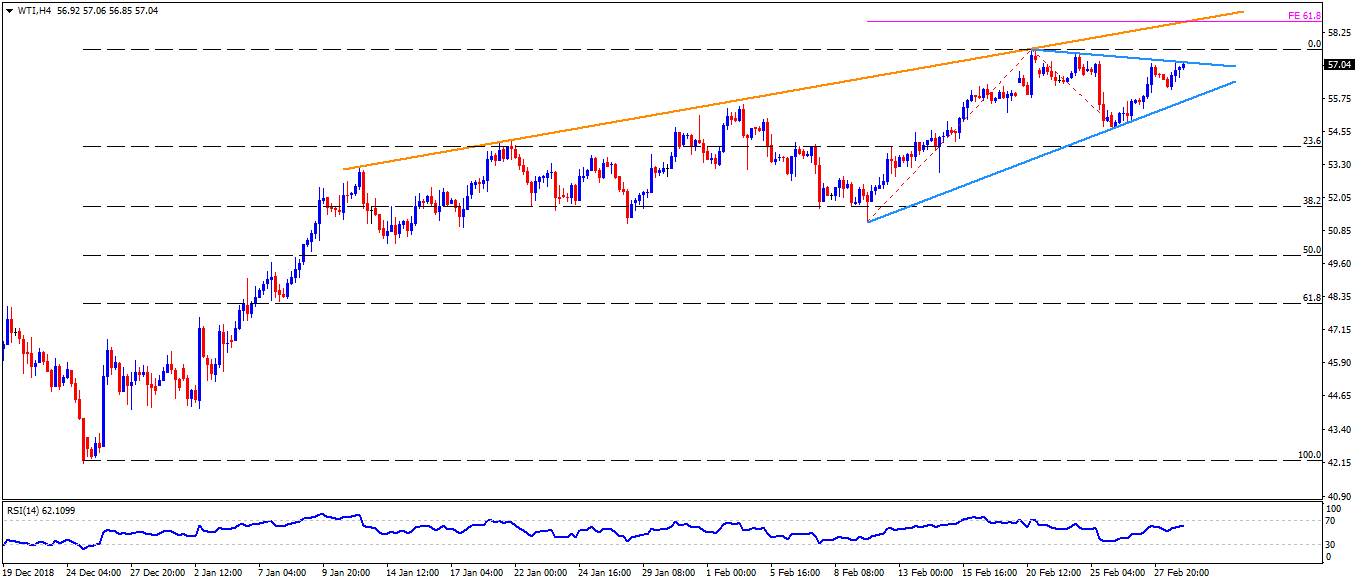
WTI 4-Hour chart
- An immediate descending trend-line joining highs marked on February 20 and 22 can limit the quote’s nearby upside at $57.10.
- On the downside, lows connecting February 11 and 26 present adjacent support around $56.00.
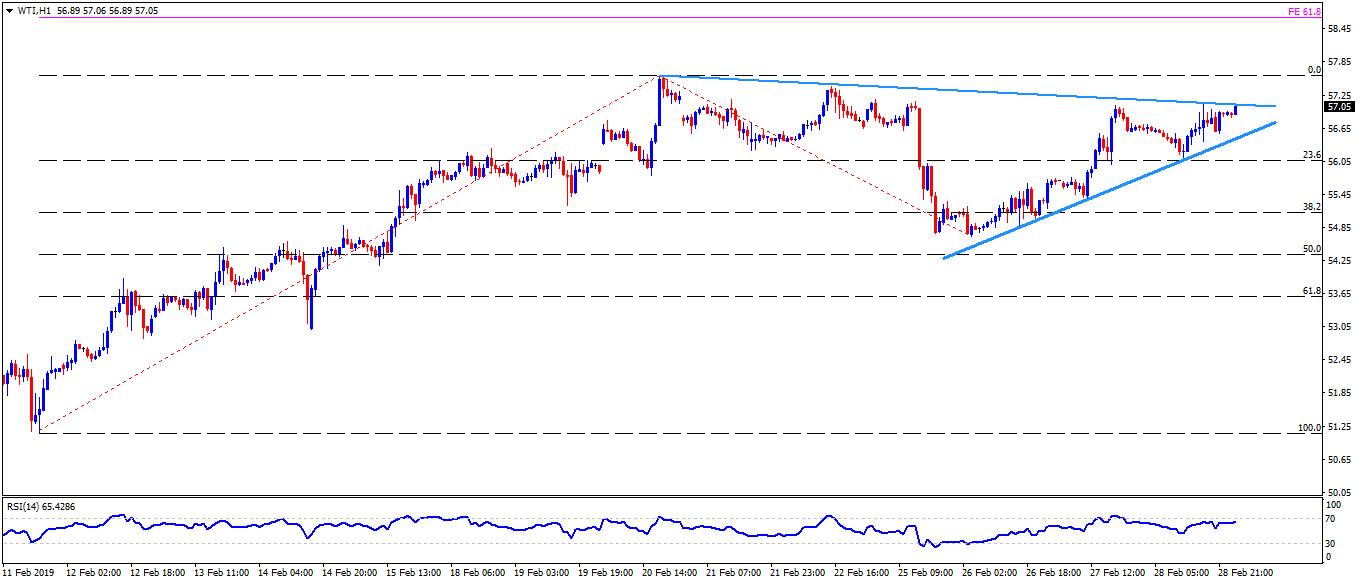
WTI hourly chart
- On the break of $57.10 immediate resistance, $57.90 and 61.8% Fibonacci expansion of February 11 to 26 move at $59.00 can entertain the optimists.
- There prevails another support-line at $56.80 while joining lows since Tuesday that might limit nearby declines.