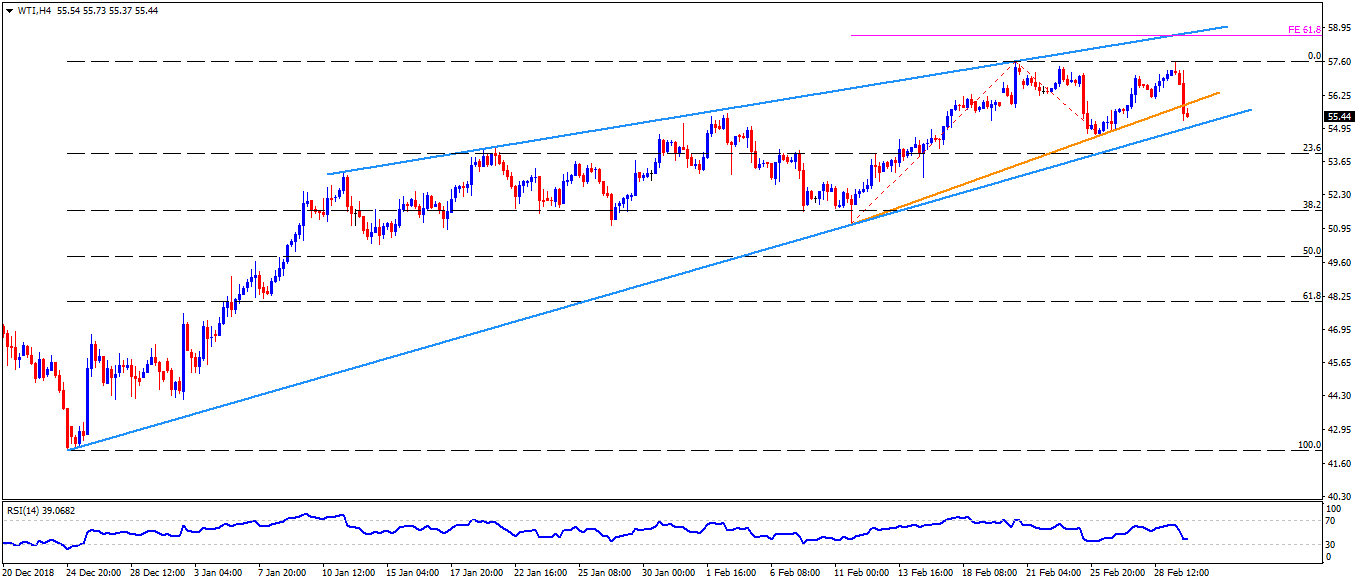
- WTI settled around $55.45 before the opening bell rings on Monday.
- The energy benchmark dropped beneath two-week old trend-line on Friday but didn’t slip under another support-line that joins the lows marked in December 2018 and February 2019, at $55.00 now.
- Should prices refrain from declining below $5.00 support, chances of their bounce to $56.10 and then to $56.70 can’t be denied.
- However, recent high around $57.60, 61.8% Fibonacci expansion of February month moves near $58.70 and an upward sloping trend-line connecting January – February highs at $58.80 may challenge bulls then after.
- In a case when the quote can’t turn sellers away and drop under $55.00, 23.6% Fibonacci retracement of its December – February increase at $53.90 and $52.80 are likely immediate supports to appear on the chart.
- Additionally, bears’ control over the momentum after $52.80 might not refrain from calling 38.2% Fibonacci retracement level of $51.70 and $51.00 on the chart.
WTI 4-Hour chart