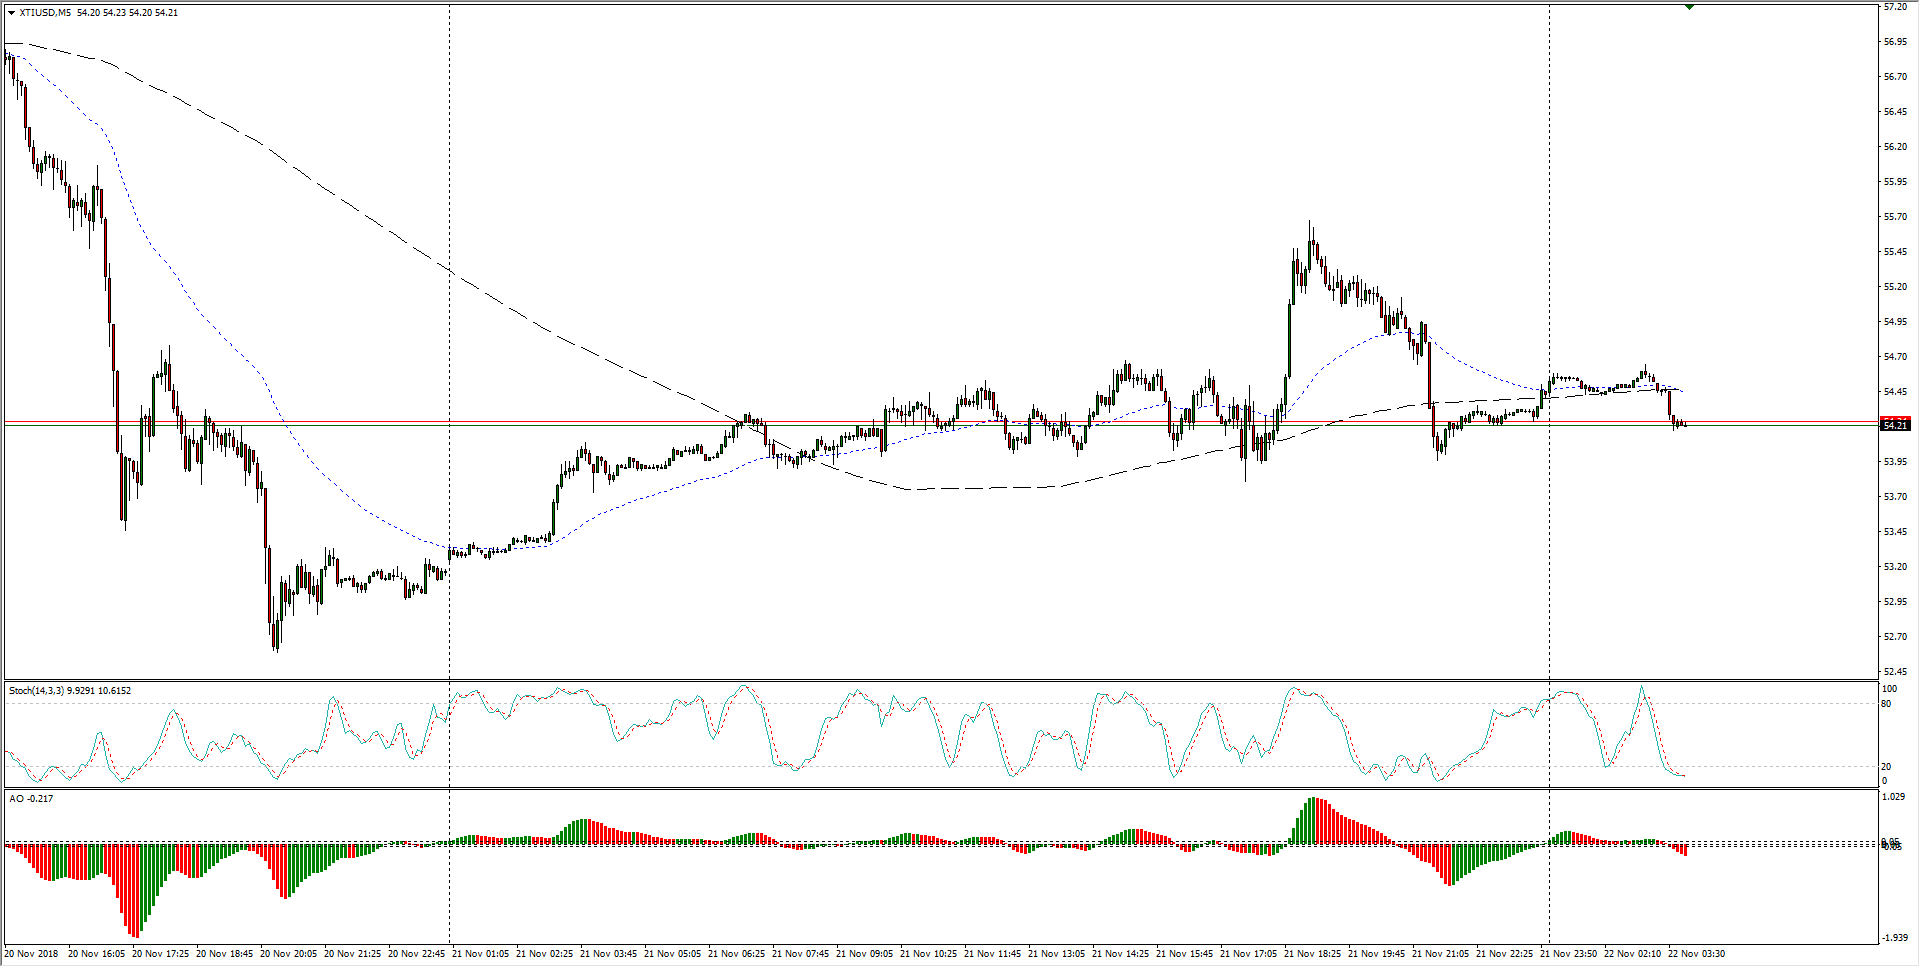
- Intraday action on US crude oil prices has gone sideways as fundamental flows keep WTI bolstered off of bottoms at 52.45, but near-term pickup above the 55.00 barrier is seeing pressure back into the middle near 54.20.
WTI Chart, 5-Minute
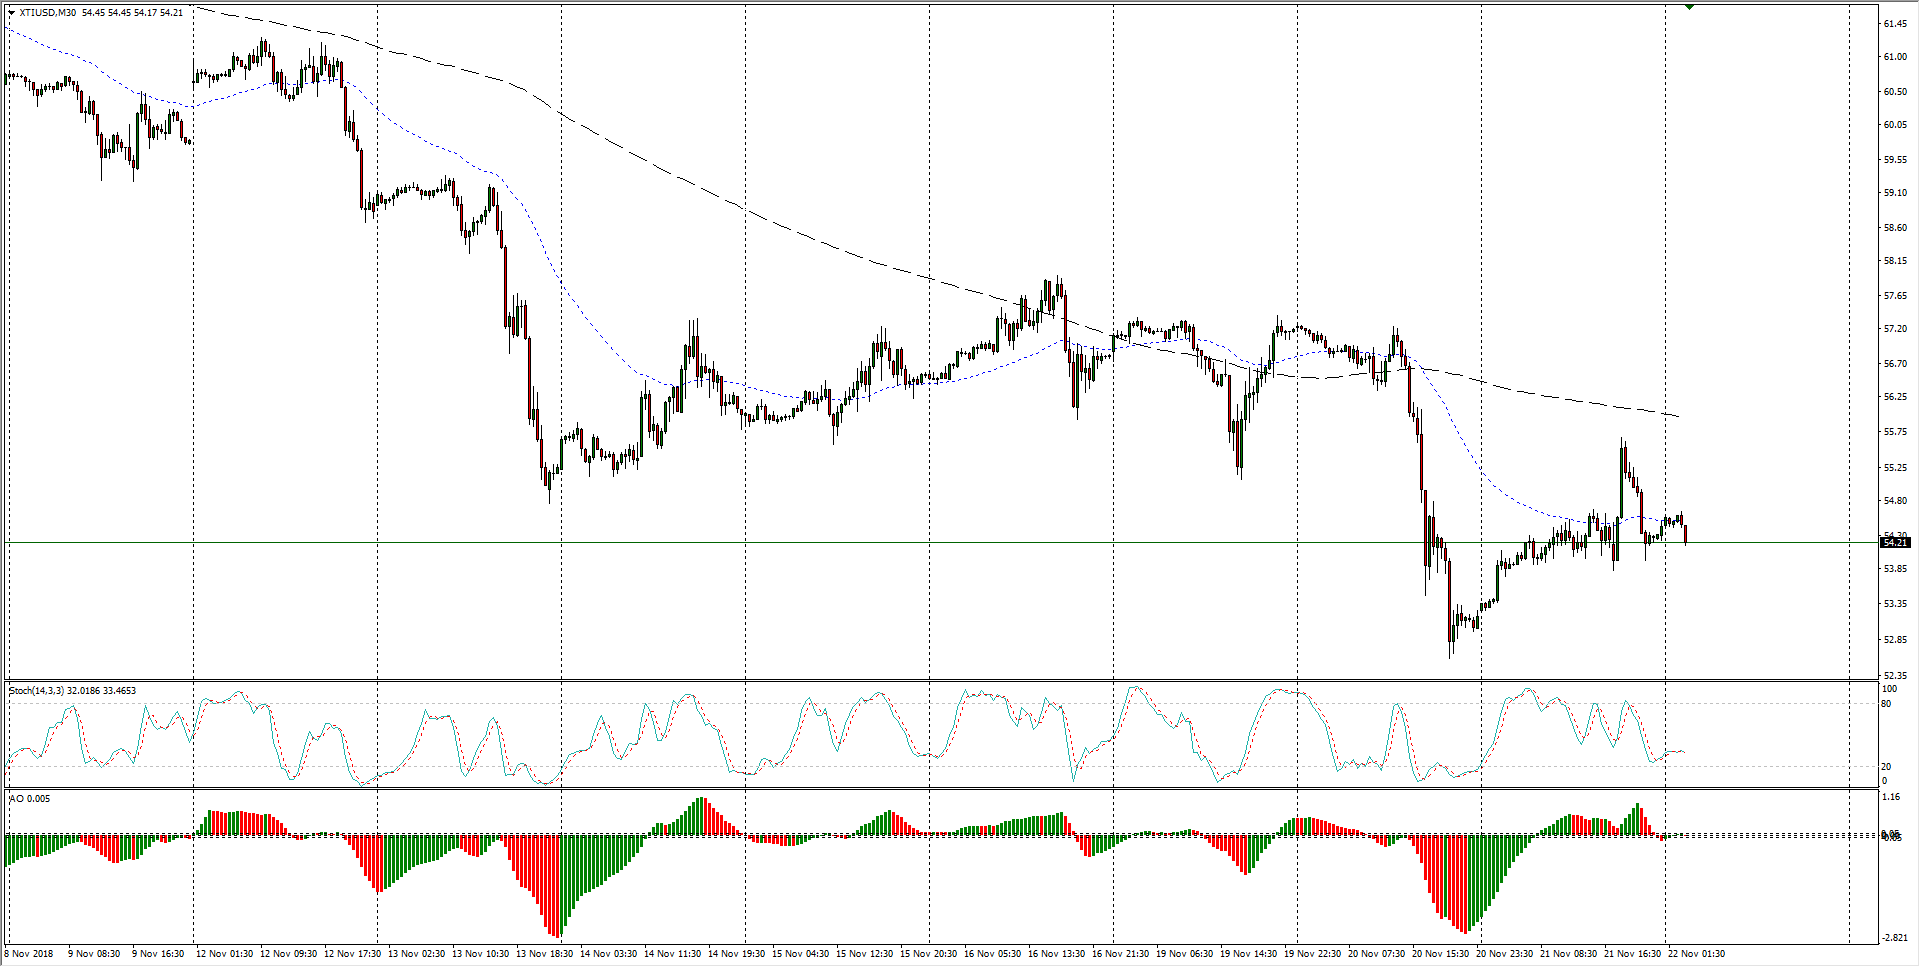
- The past two weeks sees US oil prices struggling to develop bullish momentum, and bearish action continues to undermine soft buying periods.
WTI Chart, 30-Minute
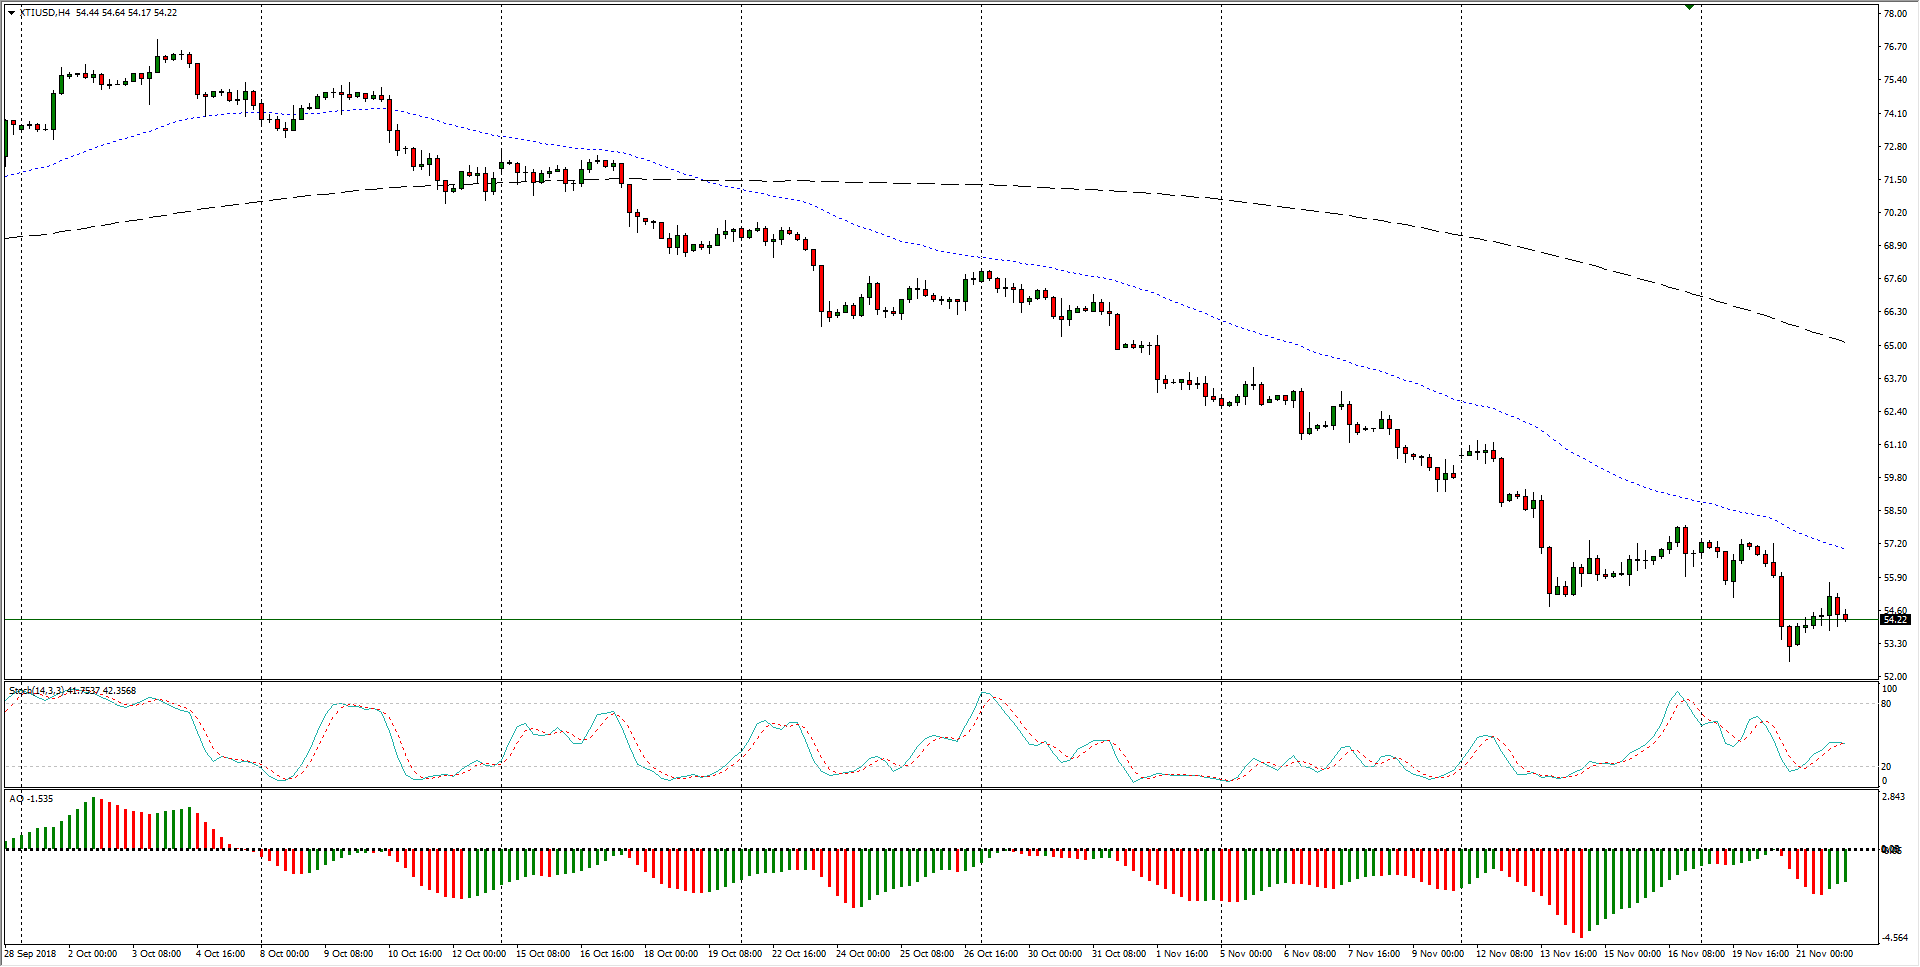
- WTI is on pace for a seventh straight week of declines, though medium-term action could be slated for a challenge from support at the 200-period moving average on 4-hour candles at 52.50.
WTI Chart, 4-Hour
WTI
Overview:
Last Price: 54.38
Daily change: -24 pips
Daily change: -0.439%
Daily Open: 54.62
Trends:
Daily SMA20: 59.74
Daily SMA50: 66.72
Daily SMA100: 67.61
Daily SMA200: 68.09
Levels:
Daily High: 54.73
Daily Low: 54.58
Weekly High: 60.93
Weekly Low: 55.21
Monthly High: 76.25
Monthly Low: 64.86
Daily Fibonacci 38.2%: 54.67
Daily Fibonacci 61.8%: 54.64
Daily Pivot Point S1: 54.56
Daily Pivot Point S2: 54.49
Daily Pivot Point S3: 54.41
Daily Pivot Point R1: 54.71
Daily Pivot Point R2: 54.79
Daily Pivot Point R3: 54.86
