- WTI looks for direction, amid bearish MACD, after posting heavy losses the previous day.
- The year 2019 to near $66.60 seems to lure buyers whereas sellers can take aim at $60.00 during further declines.
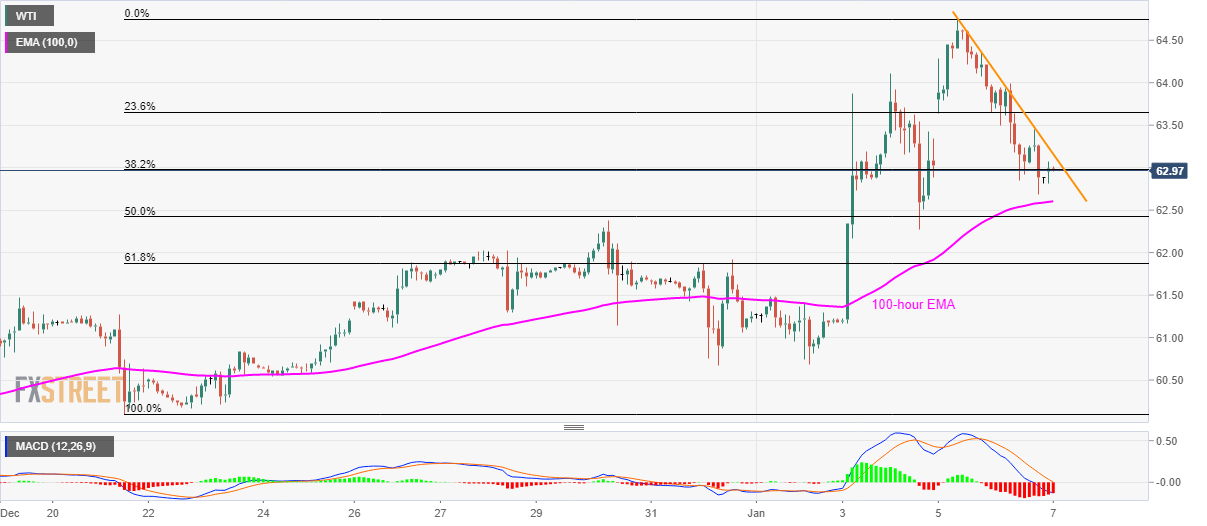
WTI seesaws near $63.00 amid the initial trading session on Tuesday. The pair struggles between 100-hour EMA and a falling trend line that joins multiple tops marked during its declines on Monday.
While bearish signals from 12-bar MACD indicator favors the black gold’s declines below 100-bar HMA, level of $62.60, 61.8% Fibonacci retracement of the quote’s rise from December 20, at $61.90, can act as follow-on support.
During the energy benchmark’s further weakness beneath $61.90, $60.60 holds the key to price declines towards $60.00.
On the contrary, a sustained break beyond the aforementioned trend line resistance, at $63.20 now, can challenge $64.00 in search of visiting the recent highs around $64.75 for one more time.
It should also be noted that the year 2019 top near $66.60 could lure the Bulls beyond $64.75.
WTI hourly chart
Trend: Bearish
