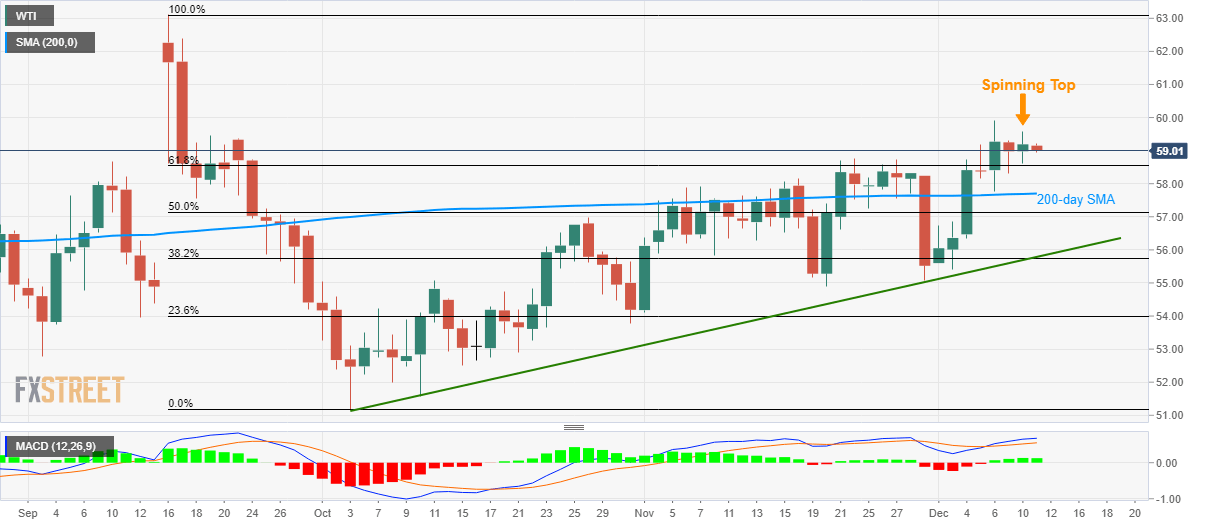
- WTI fails to register major upside despite trading beyond 200-day SMA, 61.8% Fibonacci retracement.
- The spinning top indicates traders’ indecision.
- Ascending trend line since early October adds to the support.
WTI pulls back to $59.00 ahead of Wednesday’s European session. The energy benchmark has been trading above 61.8% Fibonacci retracement of its September-October declines off-late. Even so, the spinning top candlestick suggests traders’ indecision.
With this, sellers will wait for a downside break of 61.8% Fibonacci retracement, at 58.54, to revisit the 200-day Simple Moving Average (SMA) level of $57.70.
During the black gold’s further declines, 50% Fibonacci retracement near $57.10 and an upward sloping trend line since October 03, close to $55.80, will be the key to follow.
Alternatively, buyers will look for an upside break of the monthly high of $59.90 to aim for $61.00 and September month high near $63.15.
WTI daily chart
Trend: Pullback expected
