-
- XAU/USD posts fresh gains but remains capped by 200-period SMA.
- Higher US inflation is helping the precious metal to stay bid.
- US ISM and FOMC meeting minutes can provide fresh impetus to the market.
- Technically, 200-period SMA holds importance for buyers to overcome.
XAU/USD posts fresh three-week highs near the $1810 zone today as the Dollar corrected further lower during the earlier European session. Although the Dollar bounced back and weighed on other currencies across the board, it couldn’t win against the gold.
Indeed, inflation in the US is already as much as 5%. Inflationary expectations, according to the University of Michigan estimates, reached 4.6% in May. This is the record high of the decade. So why isn’t gold flying up like it did in the first half of 2020?
The fact is that inflationary expectations are far from the only factor that affects the cost of precious metals.
Statistics show that an increase in inflation expected by investors leads to an increase in gold. This makes sense because gold is a defensive asset and a valuable rare metal. In addition, it is universally in demand in the industry.
US ISM Services PMI data
Moving ahead, we have US ISM Services PMI data due on the day. The forecast for June and May readings are quite close. We expect no big surprise, but if the figures are dramatically higher, we can see a dip in gold prices.
Further ahead, we have FOMC meeting minutes tomorrow that can potentially bring huge volatility to the gold prices. Investors are keen to find the tone of FOMC members and their consensus on policy tightening and rate forecast.
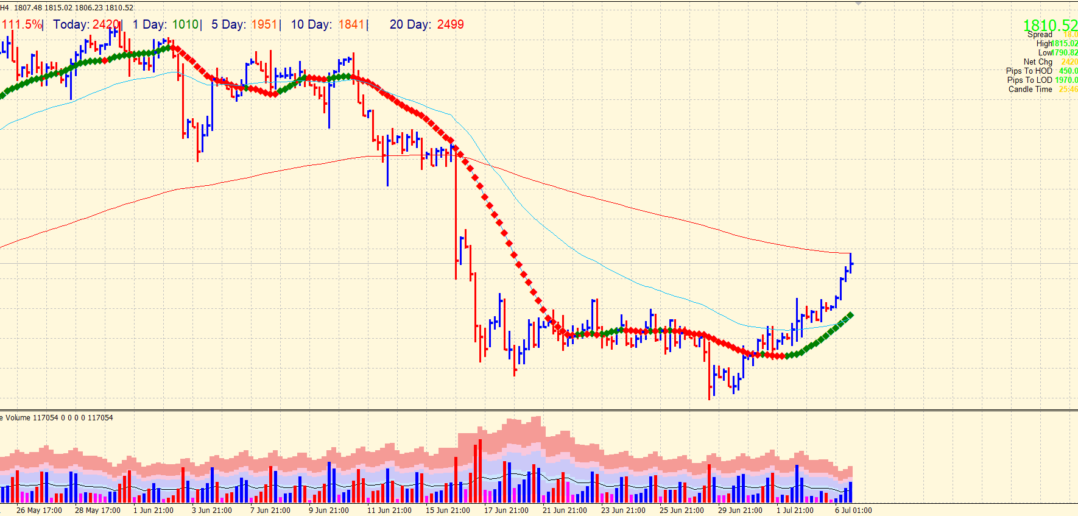
XAU/USD technical view: Key levels to watch
The 4-hour chart tells an interesting story. The price of gold went higher but got rejection at 200-period SMA at $1814 and retreated back to $1808. The price of gold may find support near the congestion of 20 and 50 SMAs on the chart at $1787 area. If the price closes below the $1787 mark, we can expect a continuation of bearish dominance. However, any close above $1800 will target a breakout of 200-period SMA ($1814), which can lead the rally to $1825, followed by $1844.
Looking to trade forex now? Invest at eToro!
67% of retail investor accounts lose money when trading CFDs with this provider. You should consider whether you can afford to take the high risk of losing your money.
