- XLM price had a significant 13% breakout in the past 24 hours above key resistance level.
- Stellar bulls managed to confirm a daily uptrend for the first time since February 13.
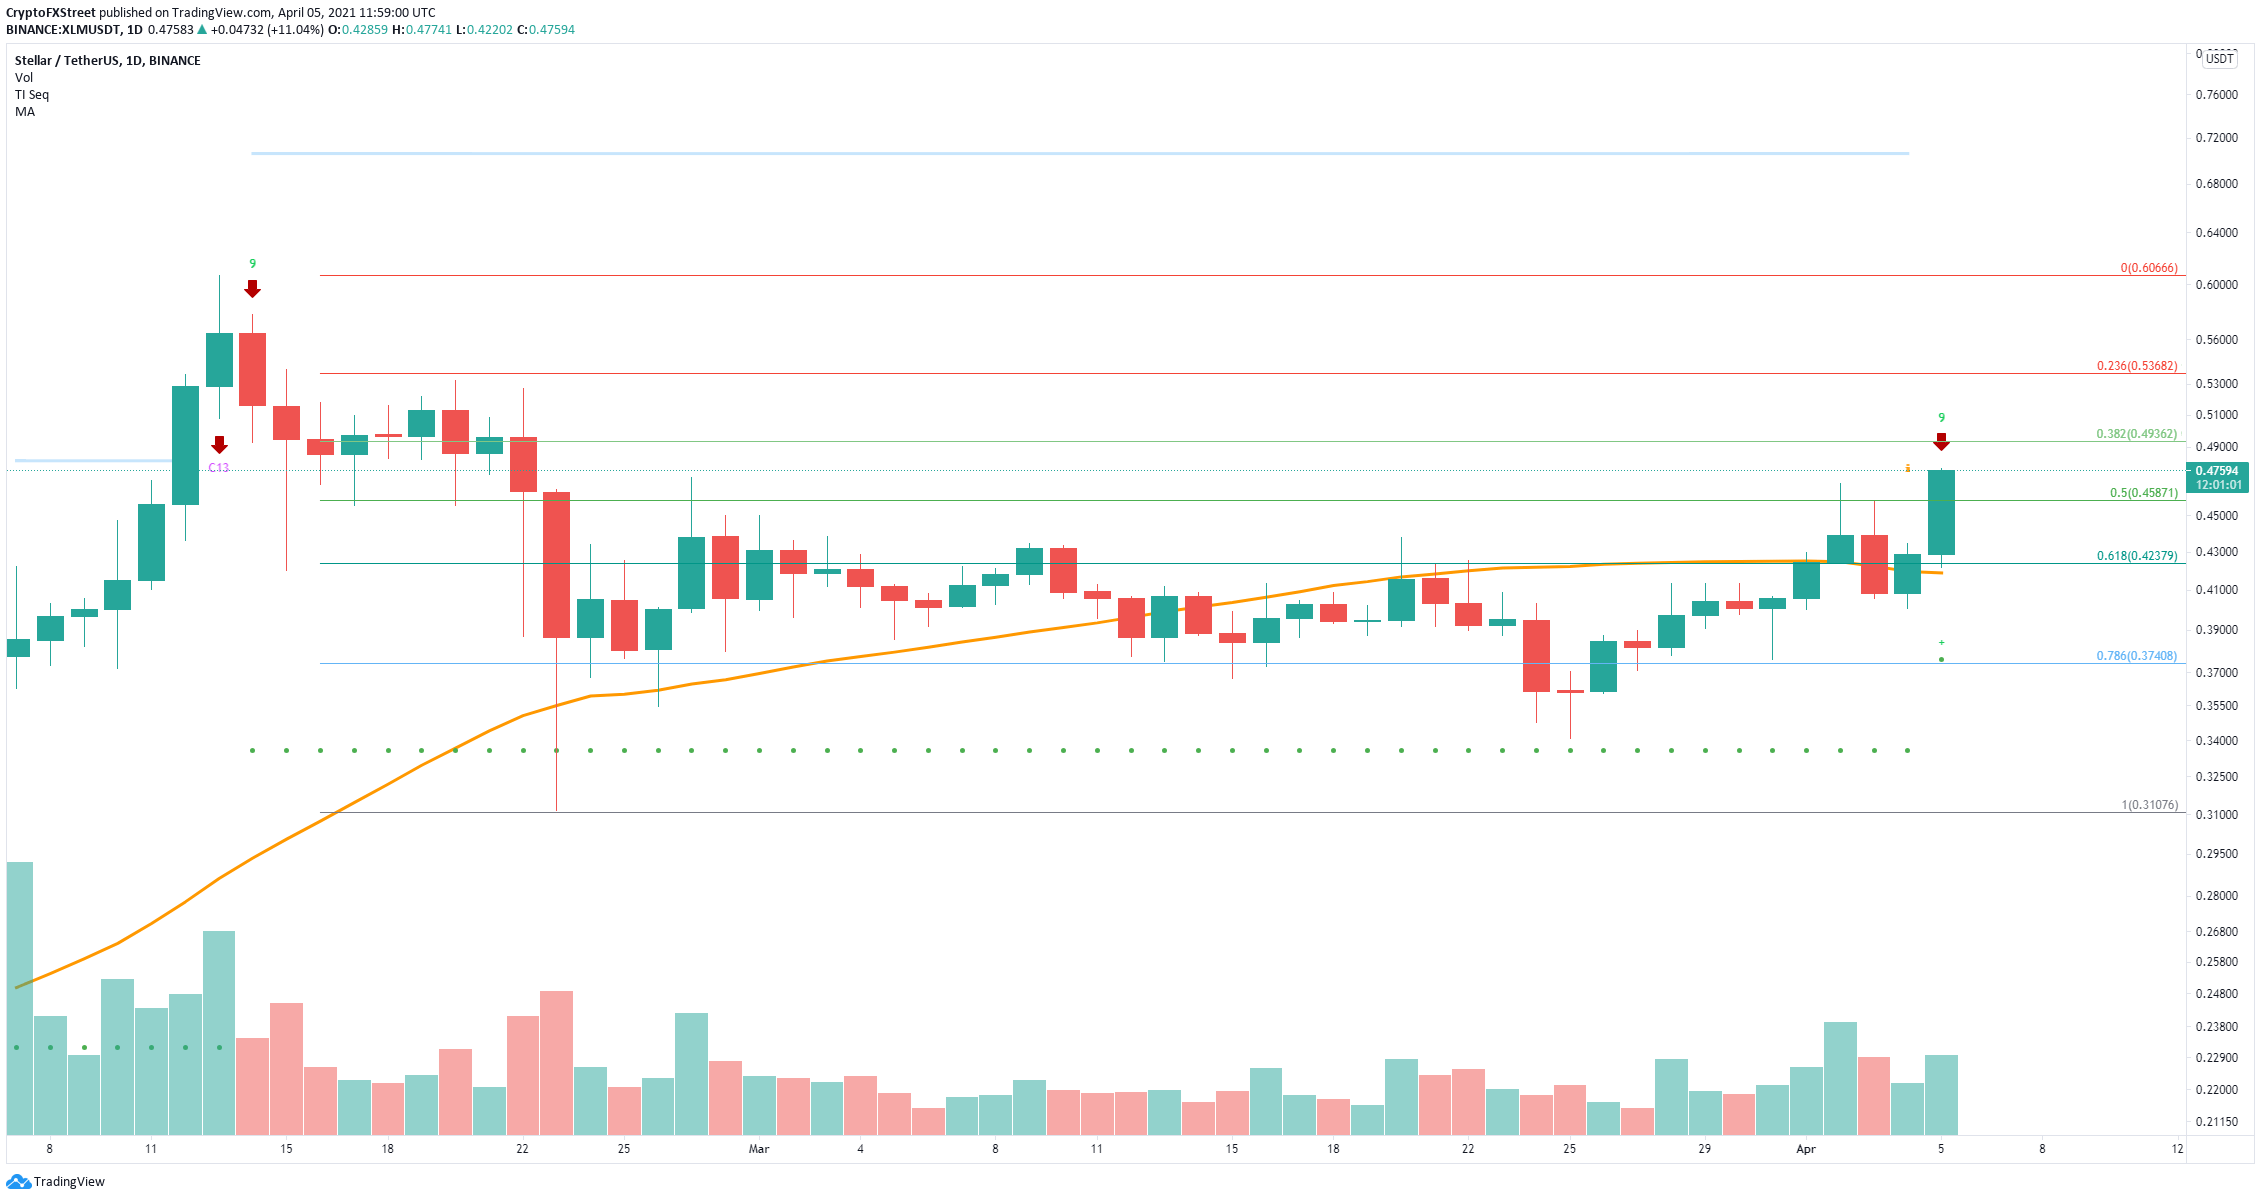
- XLM price could be poised to fall as the TD Sequential indicator has just presented a sell signal on the daily chart.
Stellar had several significant breakouts in the past week, and it’s up 26% in total. The digital asset managed to crack two critical resistance levels and aims for more in the short term. However, a key indicator has presented a sell signal which could pose a threat to the bullish momentum.
XLM price jumps above key resistance and aims for $0.536
XLM price cracked the 50% Fibonacci Retracement level on the daily chart at $0.458 and faces weak resistance ahead. The next potential price level is located at $0.0493, which is the 38.2% Fib level. Additionally, XLM also turned the 50-SMA level into support in the past 24 hours.
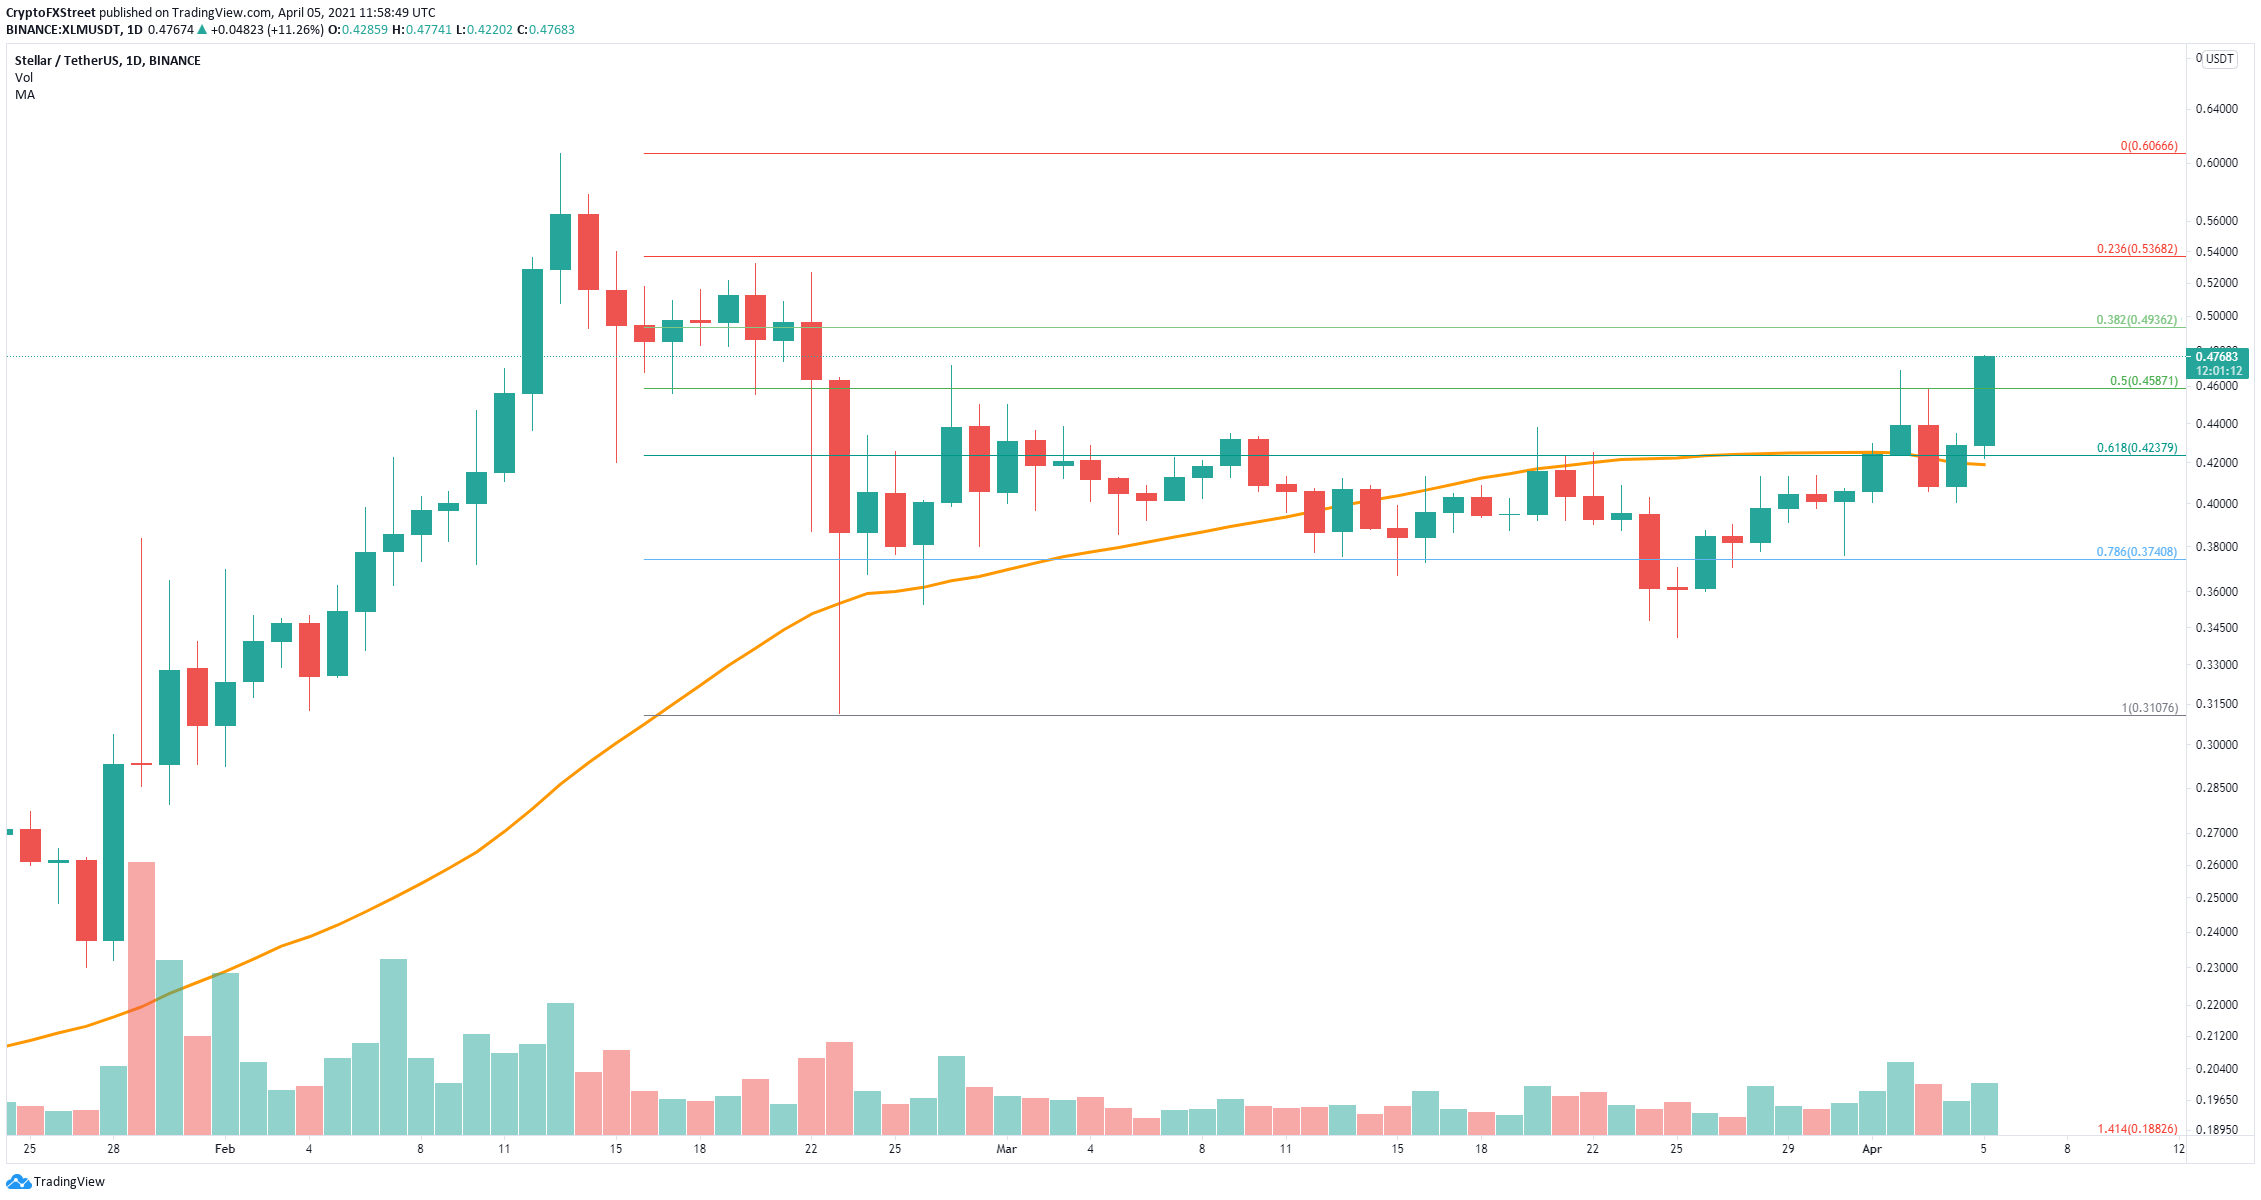
XLM/USD daily chart
A breakout above $0.50 should quickly drive XLM price towards $0.536, which is the 23.6% Fibonacci level and potentially towards the all-time high of $0.606 established on February 13.
XLM/USD daily chart
However, the TD Sequential indicator has just presented a sell signal on the daily chart, which hasn’t been invalidated yet. A rejection from $0.493 will drive XLM price down to $0.458 again and as low as $0.423, which is the 61.8% Fibonacci level and the 50-SMA support.
