XLM price has been trading sideways for the past week. The digital asset awaits a clear signal to see a breakout or breakdown. XLM has continued to trade sideways since we last reported about it. The digital asset remains locked inside a tightening range which will eventually burst. Let’s analyze some of the most important indicators to understand the most likely scenario. XLM Price could look at a 20% breakout in the short-term On the 4-hour chart, XLM has been trading sideways in a tightening range between $0.276 and $0.316. The Bollinger Bands have been squeezing notable since January 14 and indicate the digital asset is on the verge of a breakout or breakdown. 
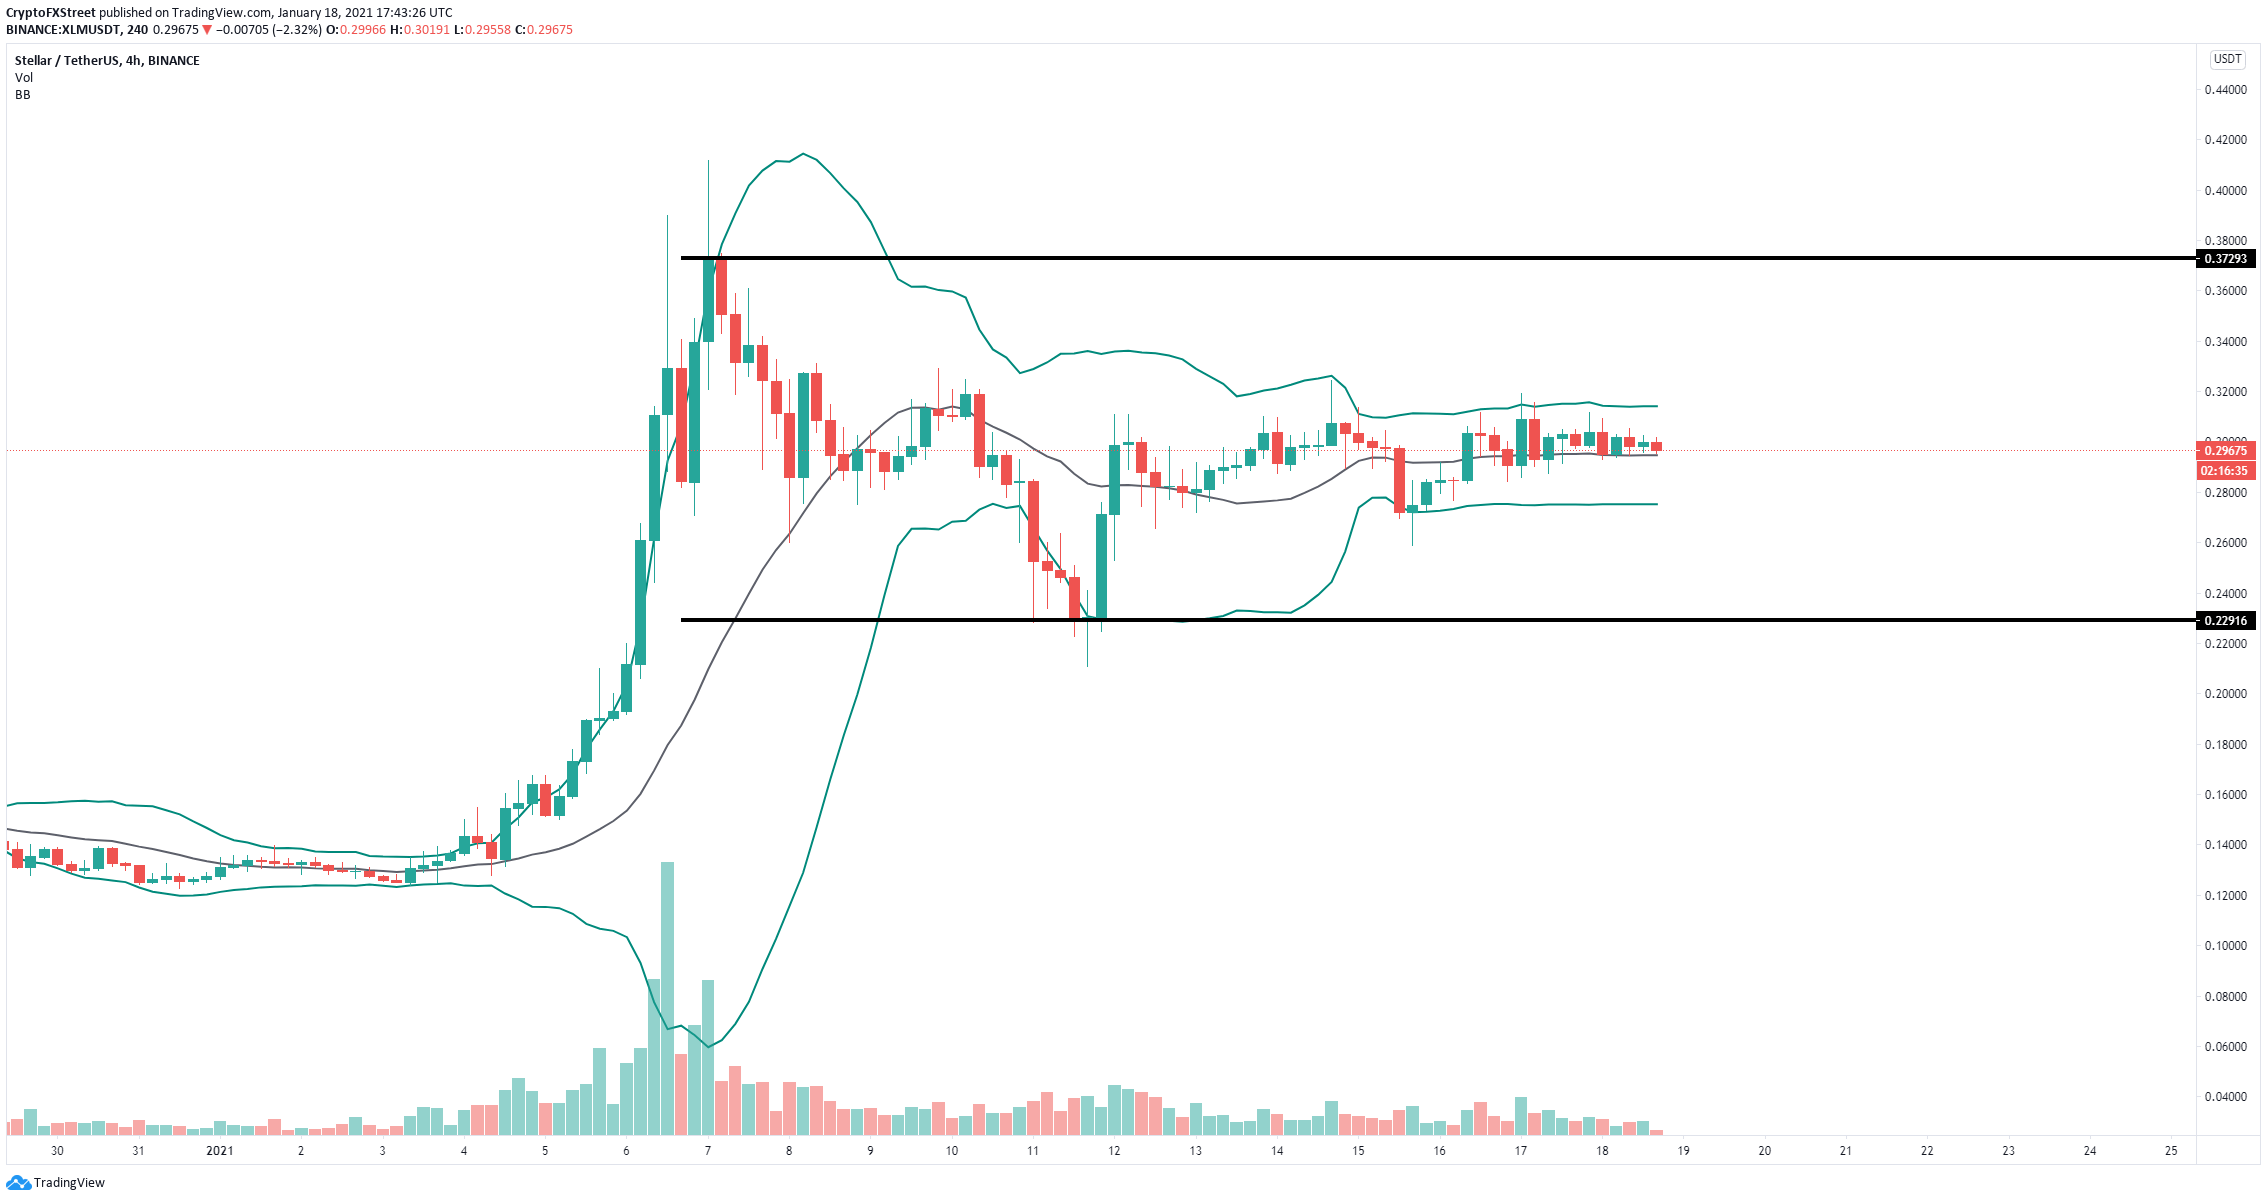
XLM/USD 4-hour chart Additionally, XLM’s trading volume also dropped massively in the past few days, which is another indication of a potential breakout or breakdown. Considering the overall trend is bullish, a breakout is more likely if the bulls can push XLM price above $0.316. The short-term price target would be $0.372. On the other hand, if the bears can see some momentum on the way down and can crack the significant support level at $0.276, XLM price can quickly fall towards $0.23 FX Street FX Street FXStreet is the leading independent portal dedicated to the Foreign Exchange (Forex) market. It was launched in 2000 and the portal has always been proud of their unyielding commitment to provide objective and unbiased information, to enable their users to take better and more confident decisions. View All Post By FX Street Crypto News share Read Next USD/JPY Price Analysis: Bulls await a breakout of consolidation, DXY weighs FX Street 2 years XLM price has been trading sideways for the past week. The digital asset awaits a clear signal to see a breakout or breakdown. XLM has continued to trade sideways since we last reported about it. The digital asset remains locked inside a tightening range which will eventually burst. Let’s analyze some of the most important indicators to understand the most likely scenario. XLM Price could look at a 20% breakout in the short-term On the 4-hour chart, XLM has been trading sideways in a tightening range between $0.276 and $0.316. The Bollinger Bands have been squeezing notable since January 14… Regulated Forex Brokers All Brokers Sponsored Brokers Broker Benefits Min Deposit Score Visit Broker 1 $100T&Cs Apply 0% Commission and No stamp DutyRegulated by US,UK & International StockCopy Successfull Traders 9.8 Visit Site FreeBets Reviews$100Your capital is at risk. 2 T&Cs Apply 9.8 Visit Site FreeBets Reviews$100Your capital is at risk. 3 Recommended Broker $100T&Cs Apply No deposit or withdrawal feesTrade major forex pairs such as EUR/USD with leverage up to 30:1 and tight spreads of 0.9 pips Low $100 minimum deposit to open a trading account 9 Visit Site FreeBets ReviewsYour capital is at risk. 4 T&Cs Apply Visit Site FreeBets ReviewsYour capital is at risk. 5 Recommended Broker $0T&Cs Apply Trade gold, silver, and platinum directly against major currenciesUp to 1:500 leverage for forex trading24/5 customer service by phone and email 9 Visit Site FreeBets ReviewsYour capital is at risk.