- XLM price is currently inside a descending triangle pattern on the 12-hour chart.
- Stellar experienced a significant spike in bullish sentiment over the past 48 hours.
- The digital asset aims for a significant 30% breakout towards $0.37.
Stellar had a considerable price spike towards $0.411 on January 7 and has been consolidating ever since. The digital asset is currently trading inside a descending triangle pattern on the 12-hour chart awaiting a breakout.
XLM price needs to break $0.28 to see a massive breakout
Stellar has established a descending triangle pattern on the 12-hour chart with the resistance trendline formed at $0.28. A breakout above this point will drive XLM price towards $0.37, a 31% move to the upside.
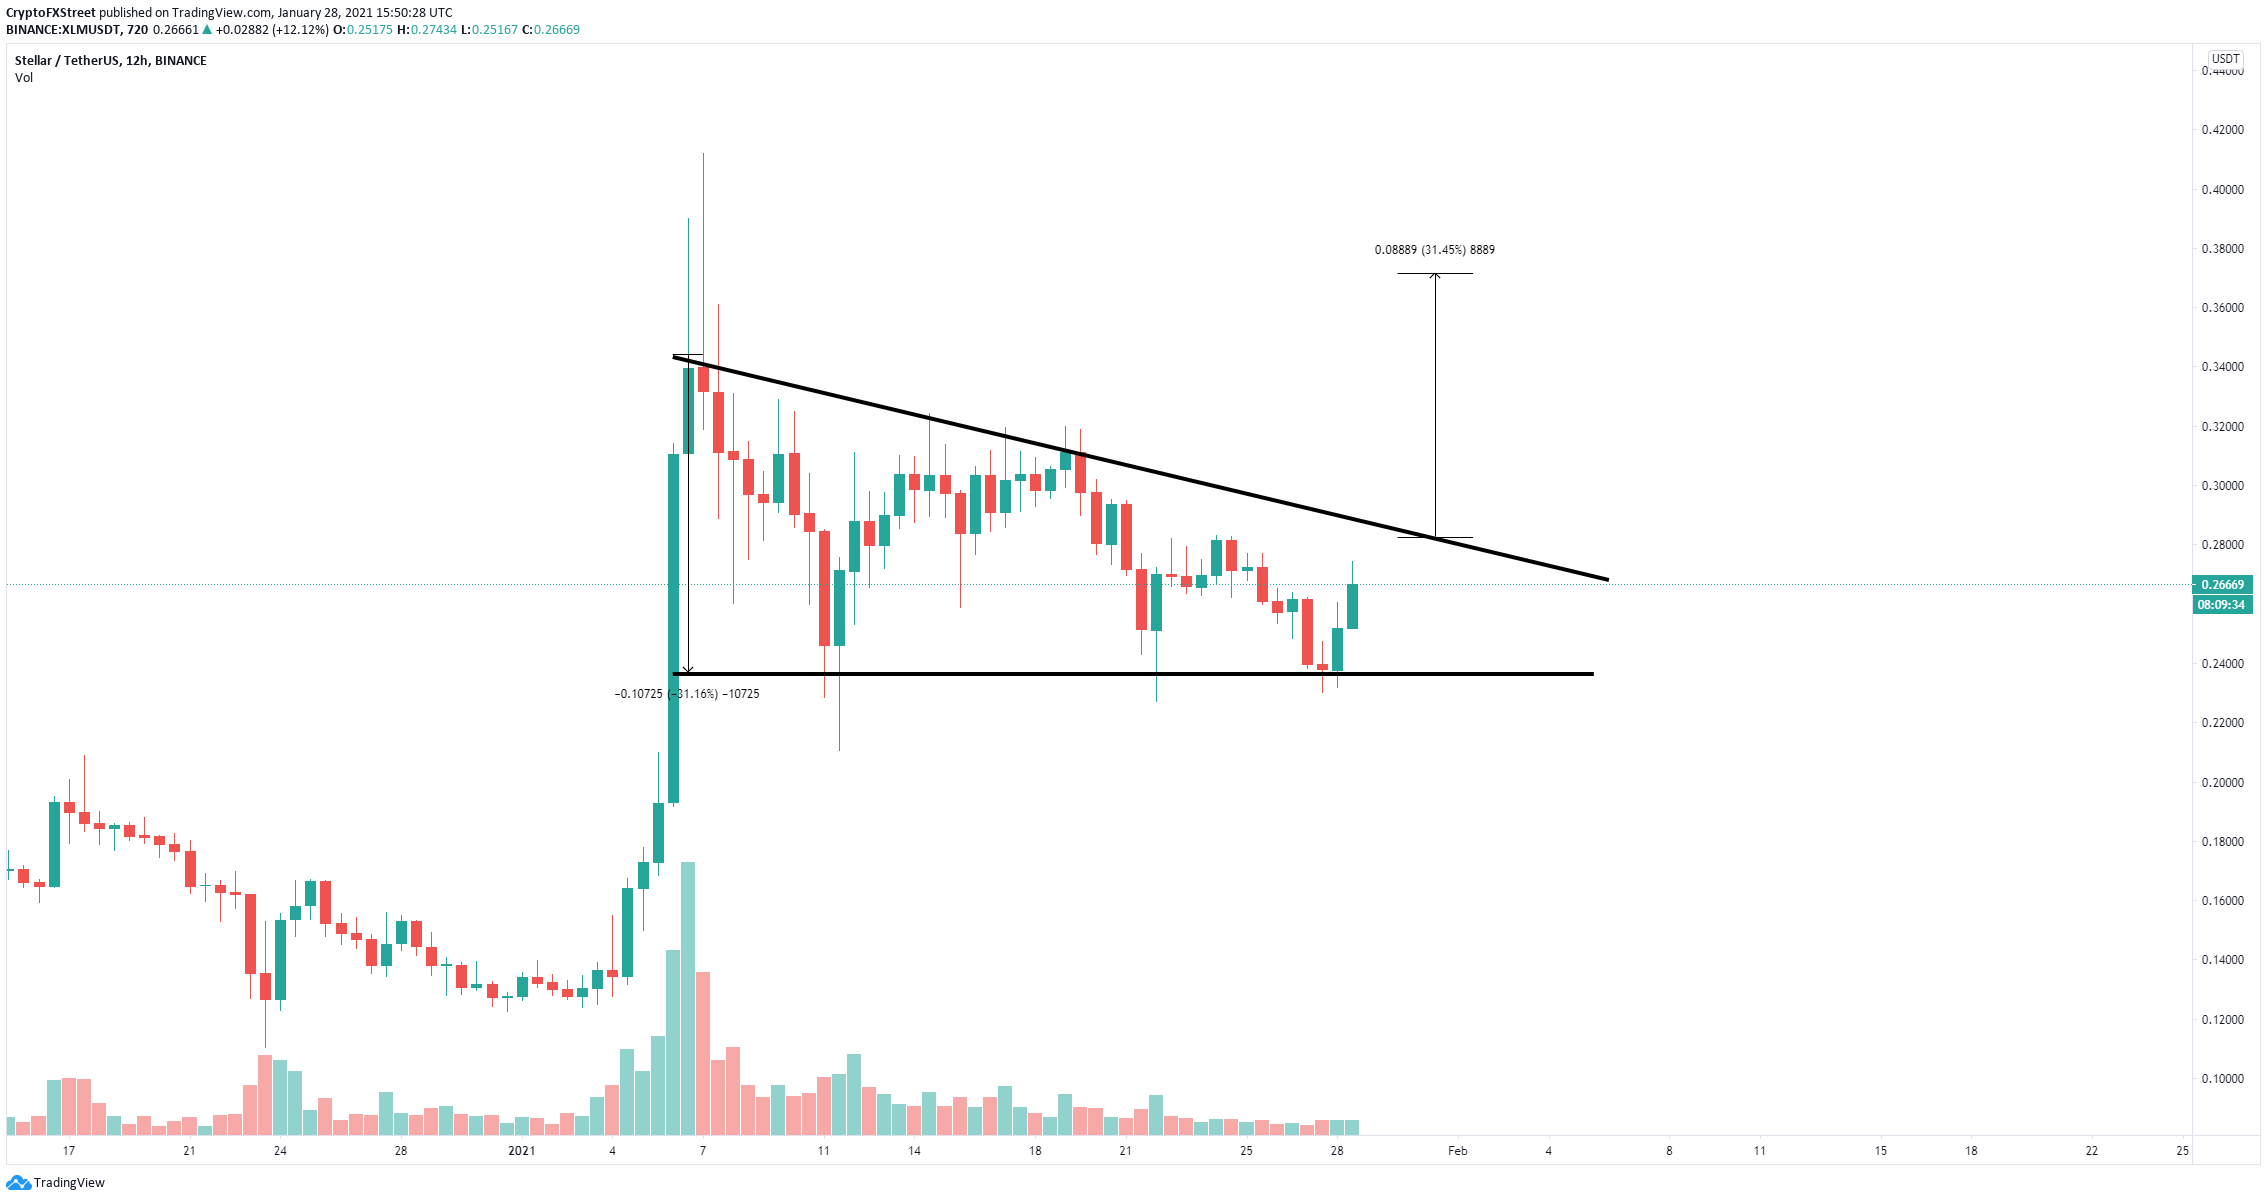
XLM/USD 12-hour chart
Although Stellar is only trading in the middle of the pattern, a massive spike in the Sentiment Balance of XLM seems to suggest that investors are extremely bullish currently. The Sentiment Balance Total indicator measures the difference between negative and positive sentiment about an asset; the higher it is, the more bullish crowds are.
%20%5B16.50.37,%2028%20Jan,%202021%5D-637474461388189727.png)
XLM Sentiment Balance Total
The last significant spike was on January 4, right before XLM price went from $0.158 to a high of $0.411, several days later. However, it’s important to remember that Stellar is still contained in the descending triangle pattern.
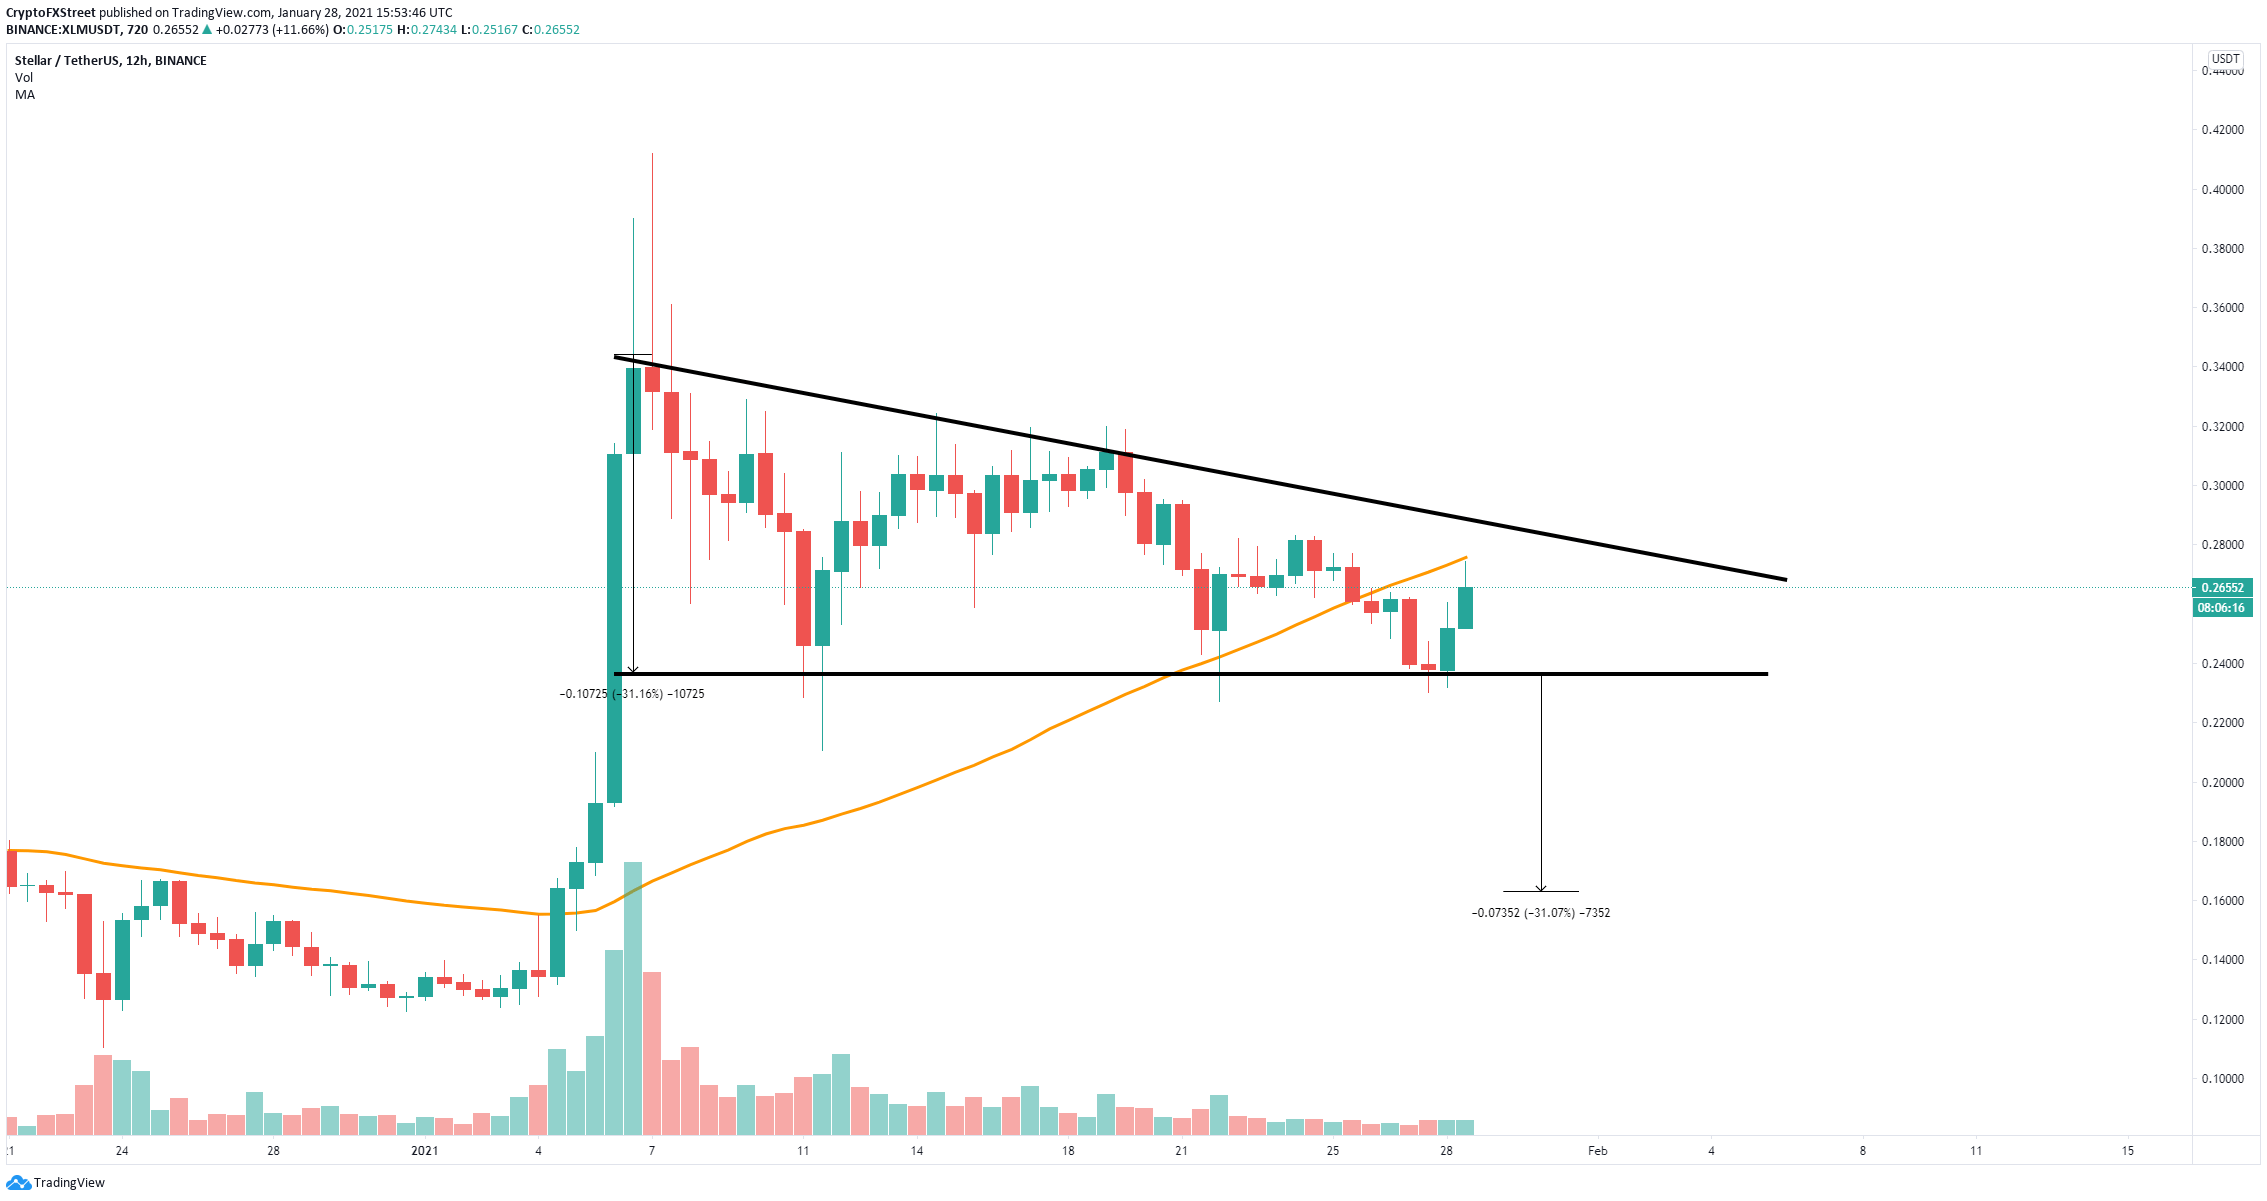
XLM/USD 12-hour chart
XLM price has just been rejected from the 50-SMA at $0.275 and could quickly fall towards the lower trendline of the pattern at $0.235. Losing this level can push Stellar down to $0.163, which is also another 31% move.
