- XLM price seems to have broken out of a descending parallel channel on the 4-hour chart.
- The digital asset looks poised for a move towards $0.40 within the next week.
Stellar had a major rally towards $0.411 that started at the beginning of 2021. Since then, the digital asset has been under consolidation and established a descending parallel channel on the 4-hour chart.
XLM price is on the verge of a breakout towards $0.4
The descending parallel channel on the 4-hour chart seems to be on the verge of cracking as XLM price is right at the top of the trendline resistance of $0.29. A breakout above this point can quickly drive Stellar towards new 2021 highs.
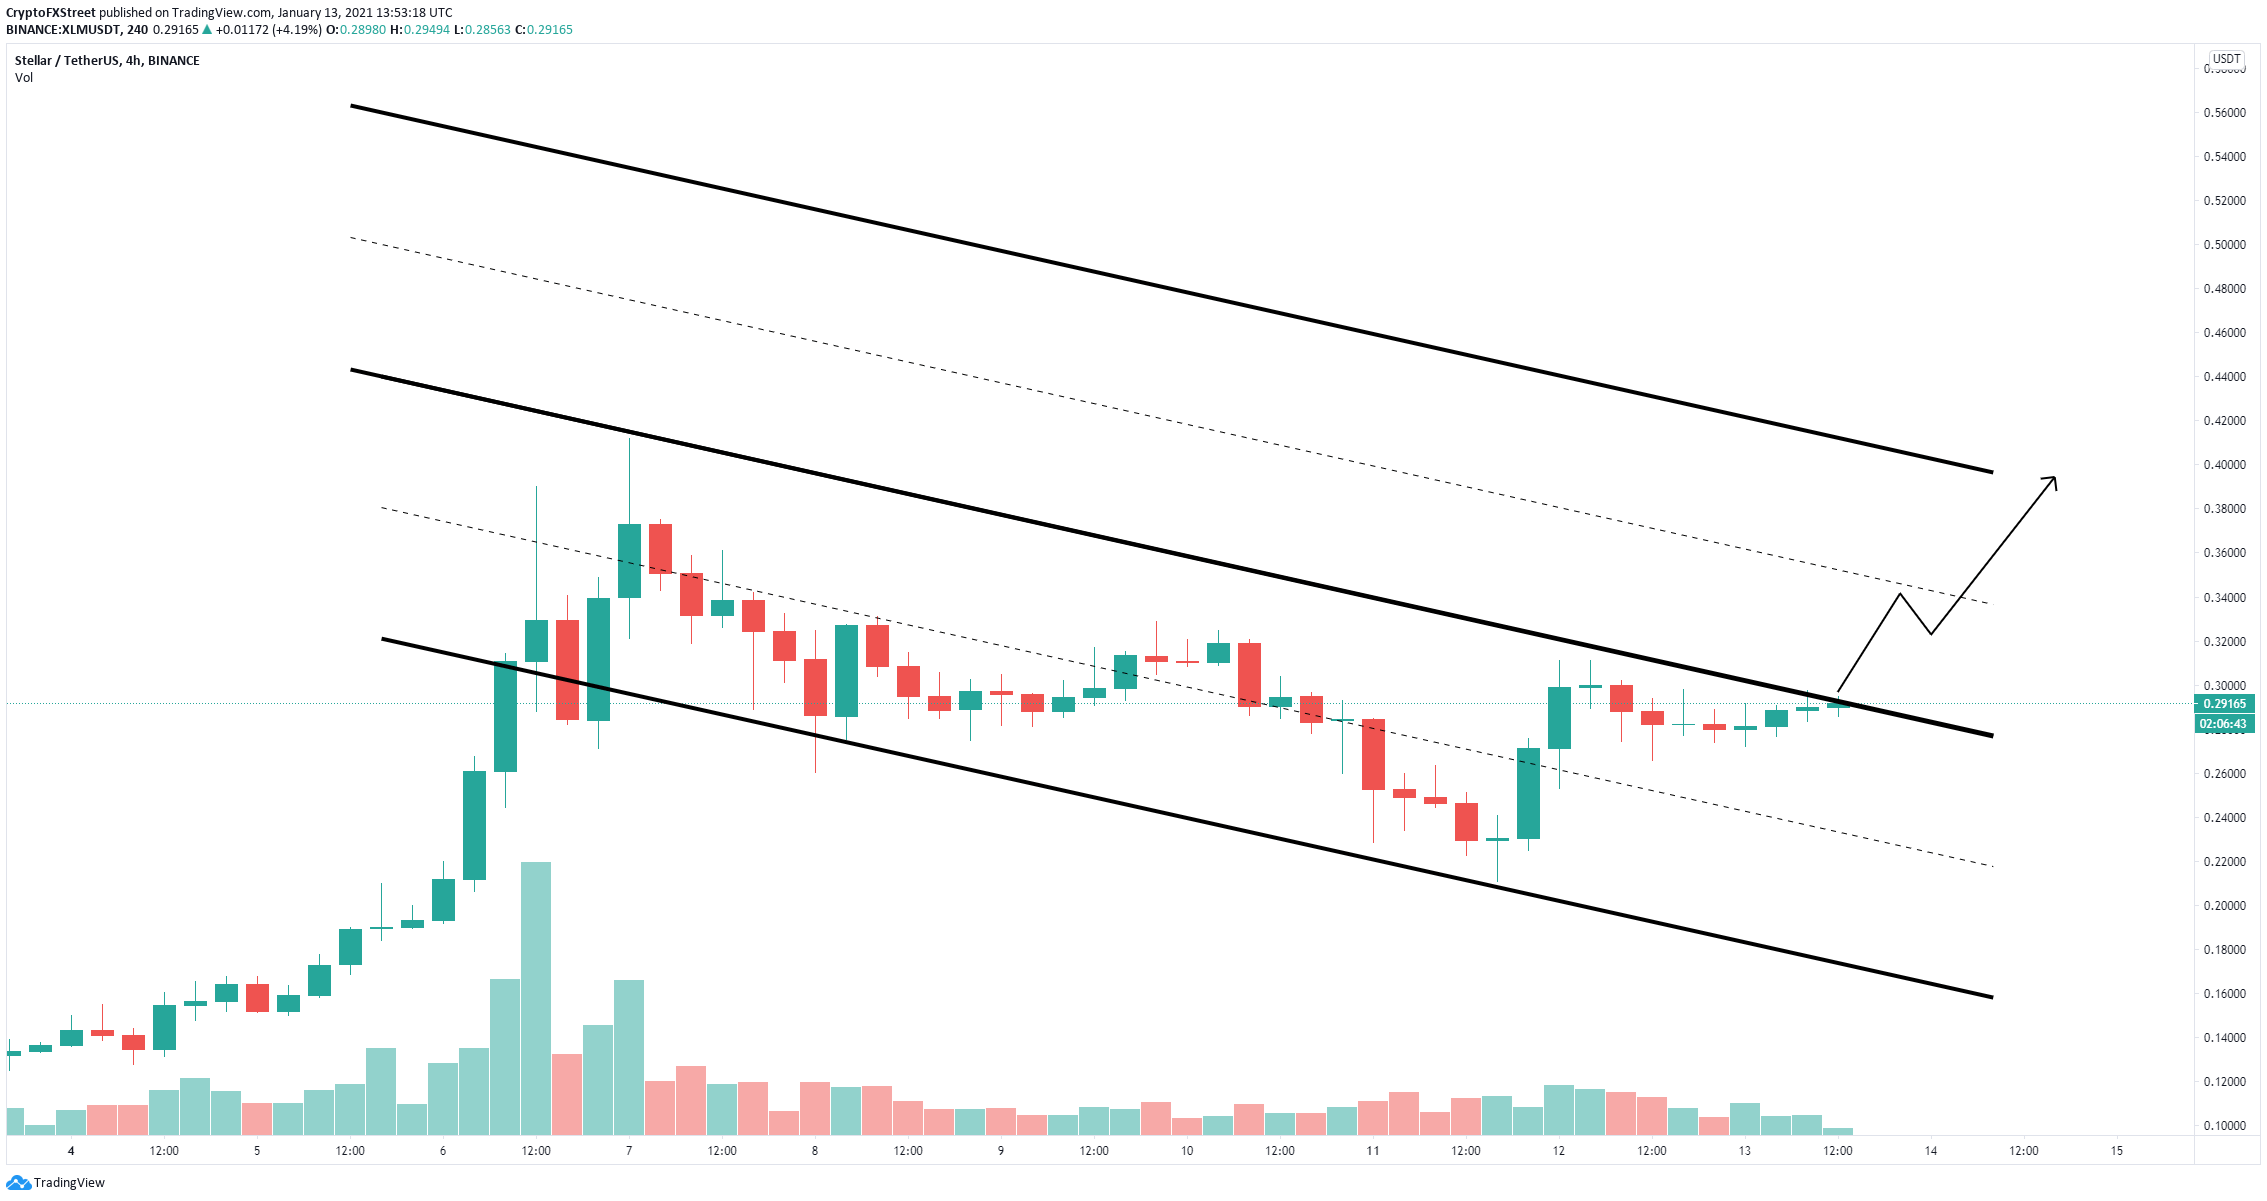
XLM/USD 4-hour chart
The breakout of the $0.29 resistance trendline can easily push XLM price towards $0.34 before a potential brief pullback and continuation towards the long-term target of $0.40.
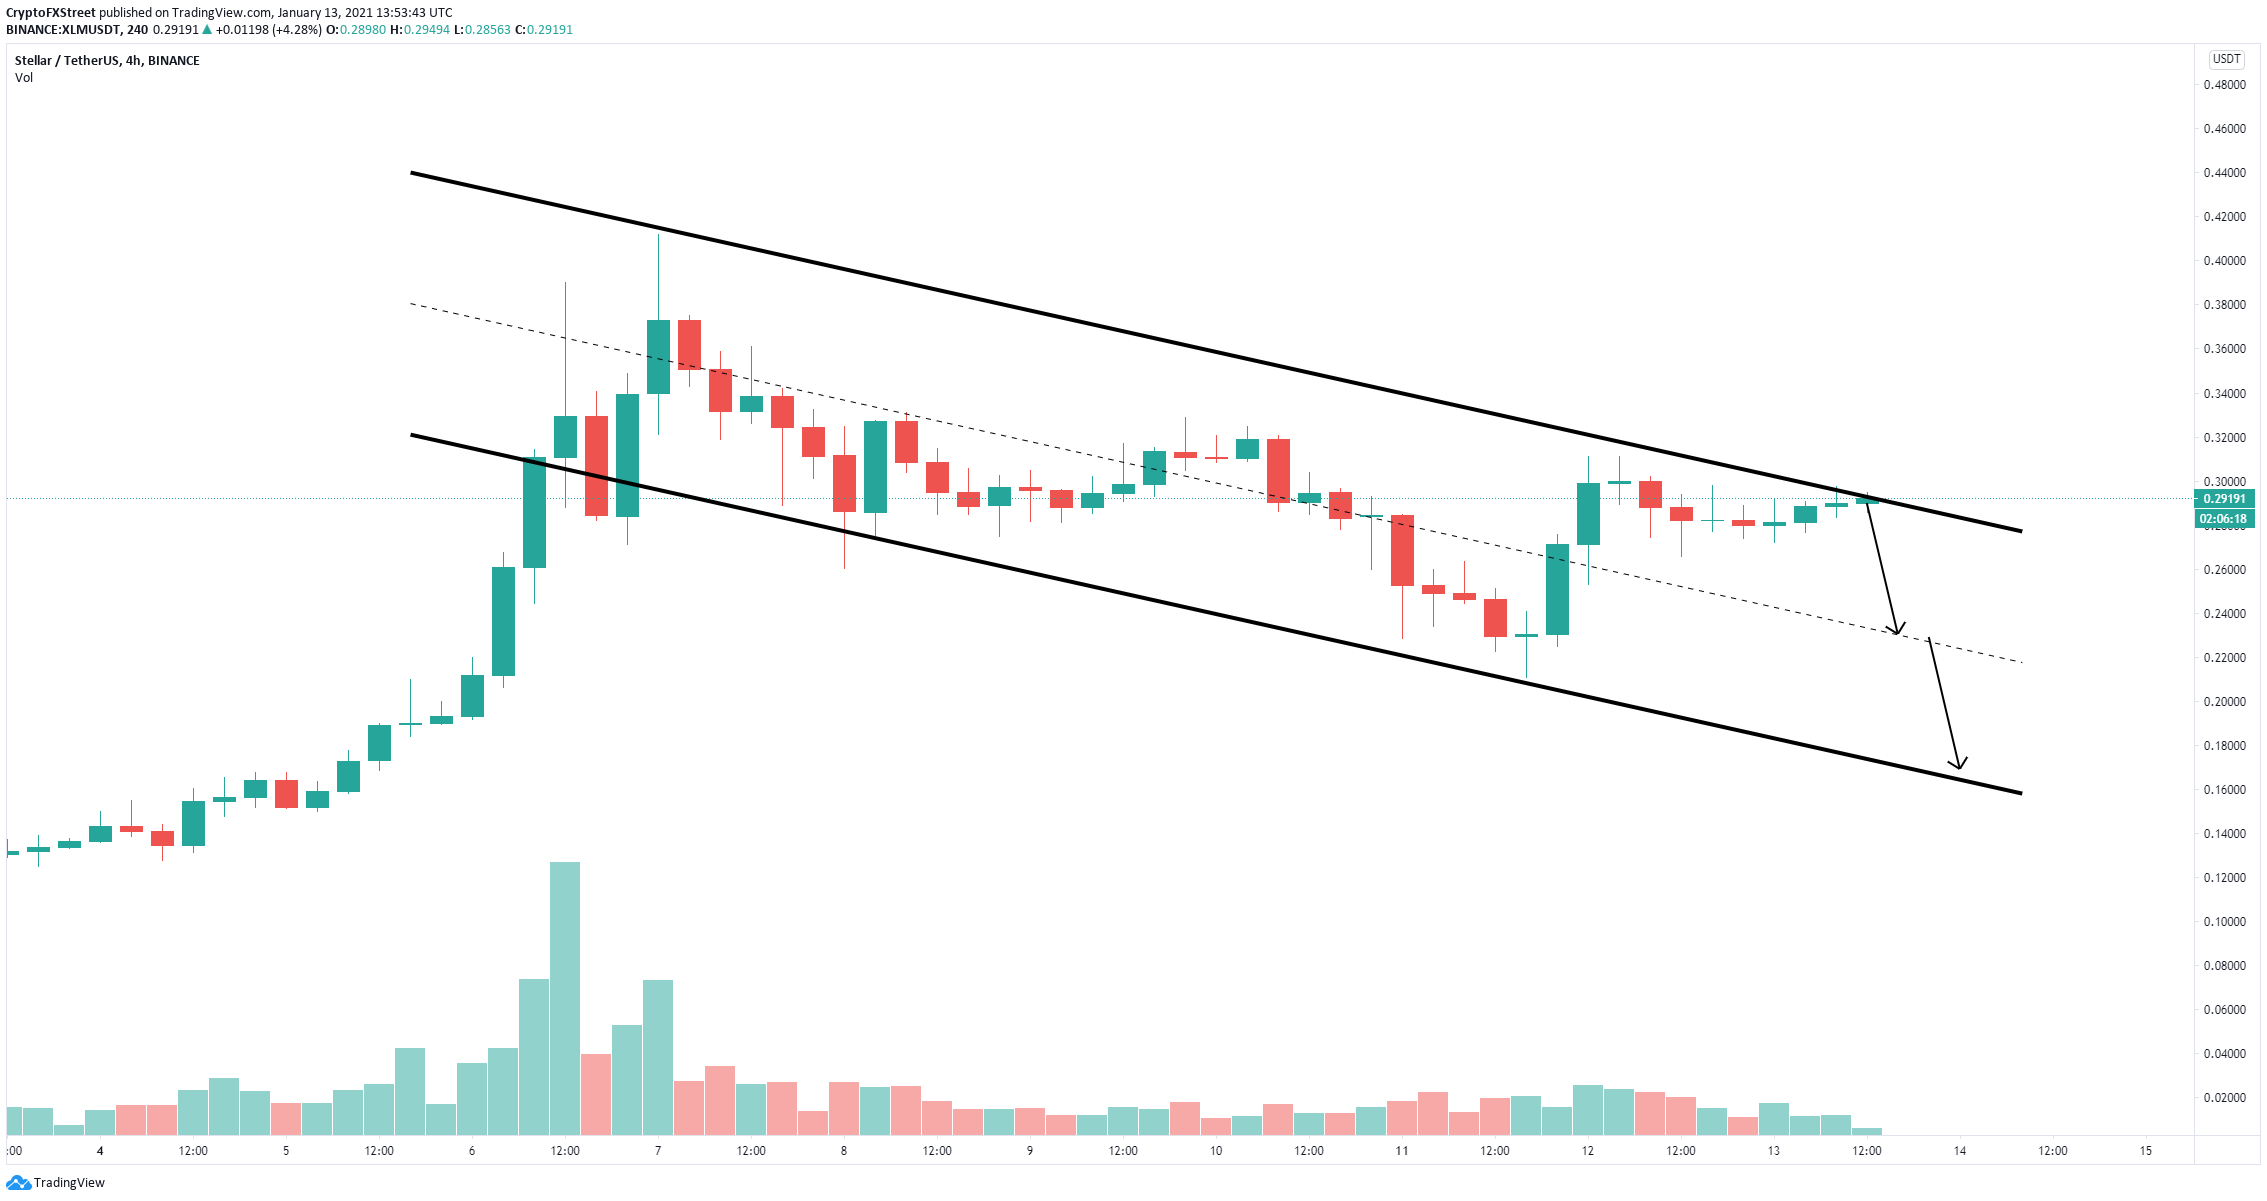
XLM/USD 4-hour chart
However, it’s also possible that XLM fails to break above $0.29 convincingly and gets rejected. This would trigger a correction down to the middle of the descending parallel channel at $0.22 and as low as $0.17.
