- XMR/USD’s price has gone down from $49.25 to $47.25, losing 4% of its price in the process.
- In the short term, the bulls need to breach $47.50 resistance line and the downward trending line.
Bears have taken over the XMR/USD market, bringing the price down from $49.25 to $47.25. With the market losing 4% of its value, the bulls need to get together and break past the $47.50 resistance line to prevent any further downward momentum.
XMR/USD daily chart
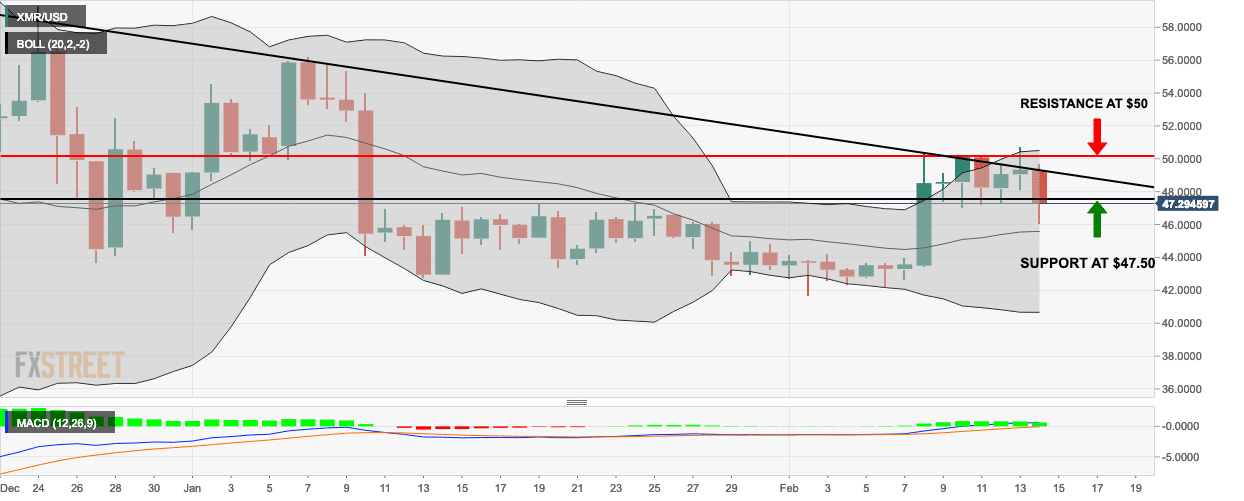
The bears managed to break past the $47.50 support line. The bulls will need to breach the $47.50 resistance and the downward trending line. The 20-day Bollinger band shows that the market is becoming more volatile. The market is still trending above the 20-day simple moving average (SMA 20) curve, but the downward momentum may bring it to the bearish territory. The moving average convergence/divergence (MACD) histogram also corroborates that fact by showing the decreasing bullishness of the market.
