XMR/USD daily chart
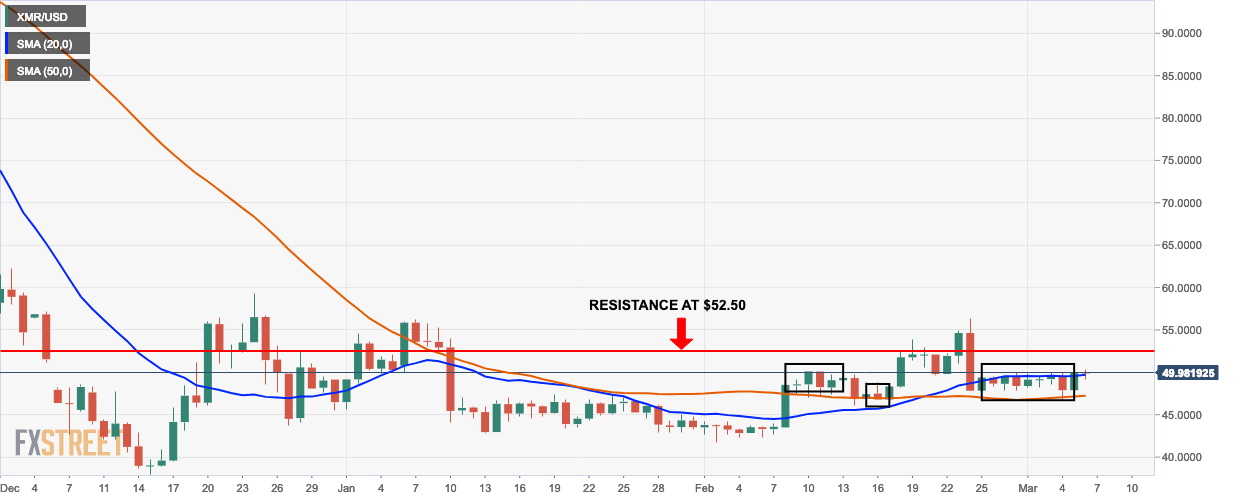
- XMR/USD is currently trading at $50.
- The market forms a flag formation which is prime for a breakout.
- XMR/USD is also currently sandwiched in between the 20-day simple moving average (SMA 20) and SMA 50.
- The SMA 20 had already crossed over SMA 50, which indicates a buy signal.
XMR/USD 4-hour chart
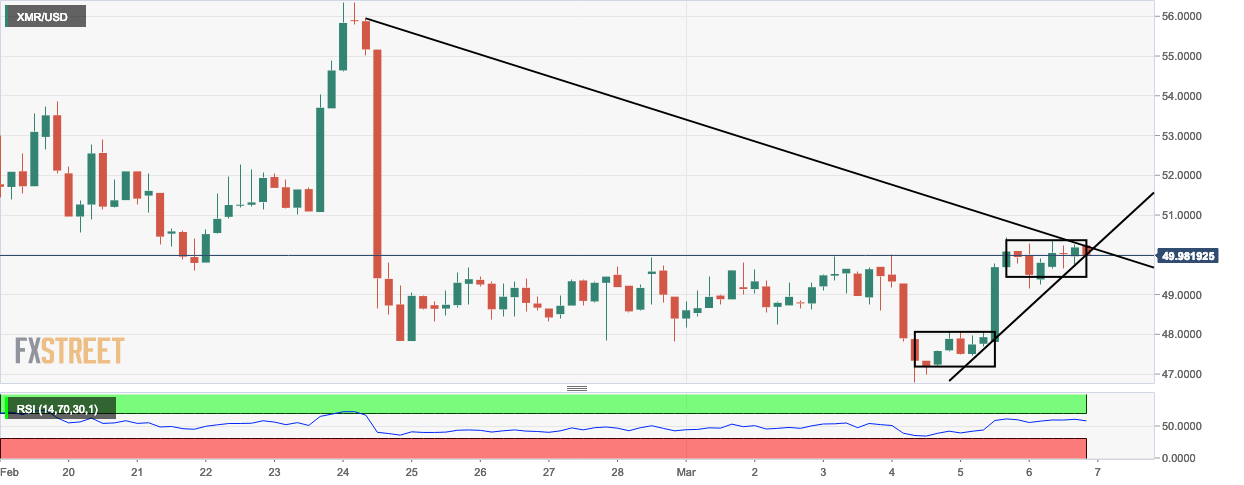
- The XMR/USD 4-hour chart shows that there is a triangle formation which is ready for a breakout.
- The relative strength index (RSI) is trending closer to the overbought territory.
XMR/USD hourly chart
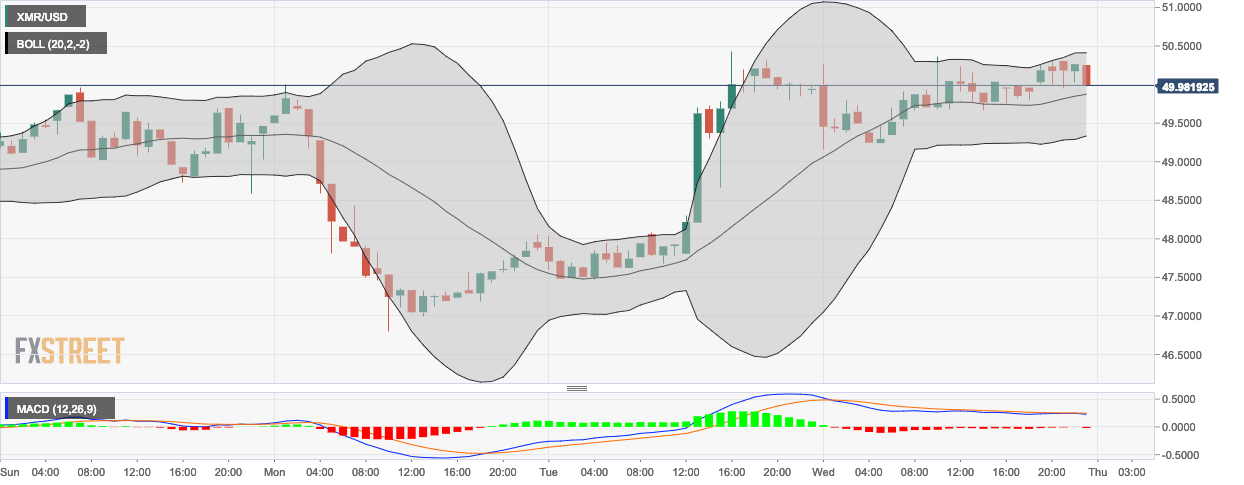
- The last session in the hourly XMR/USD chart is extremely bearish which pulled the market down towards the middle curve of the 20-day Bollinger band.
- The moving average convergence/divergence (MACD) shows that market momentum remains bearish.
Key Levels
- Resistance 3: $54.0579
- Resistance 2: $52.2469
- Resistance 1: $51.0748
- Pivot Point: $49.2638
- Support 1: $48.0917
- Support 2: $46.2807
- Support 3: $45.1086
