- XRP price is currently contained between two important simple moving averages (SMAs).
- The digital asset looks for a rebound but faces critical resistance ahead at $0.244.
XRP remains as the lagger cryptocurrency while Bitcoin and Ethereum continue climbing higher. A breakdown from an ascending triangle on October 28 destroyed all the bullish momentum for XRP which is now trading at $0.237. The key resistance seems to be located at $0.244 in the form of the 50-SMA on the daily chart. A breakout or rejection from this level will decide the next target for XRP.
XRP needs to crack $0.244 in order to rebound
After the breakdown on October 28 from the ascending triangle, bears saw a lot of continuation action which dropped the price of XRP as low as $0.228 on November 3. The next resistance level is located at the 50-SMA at $0.244.
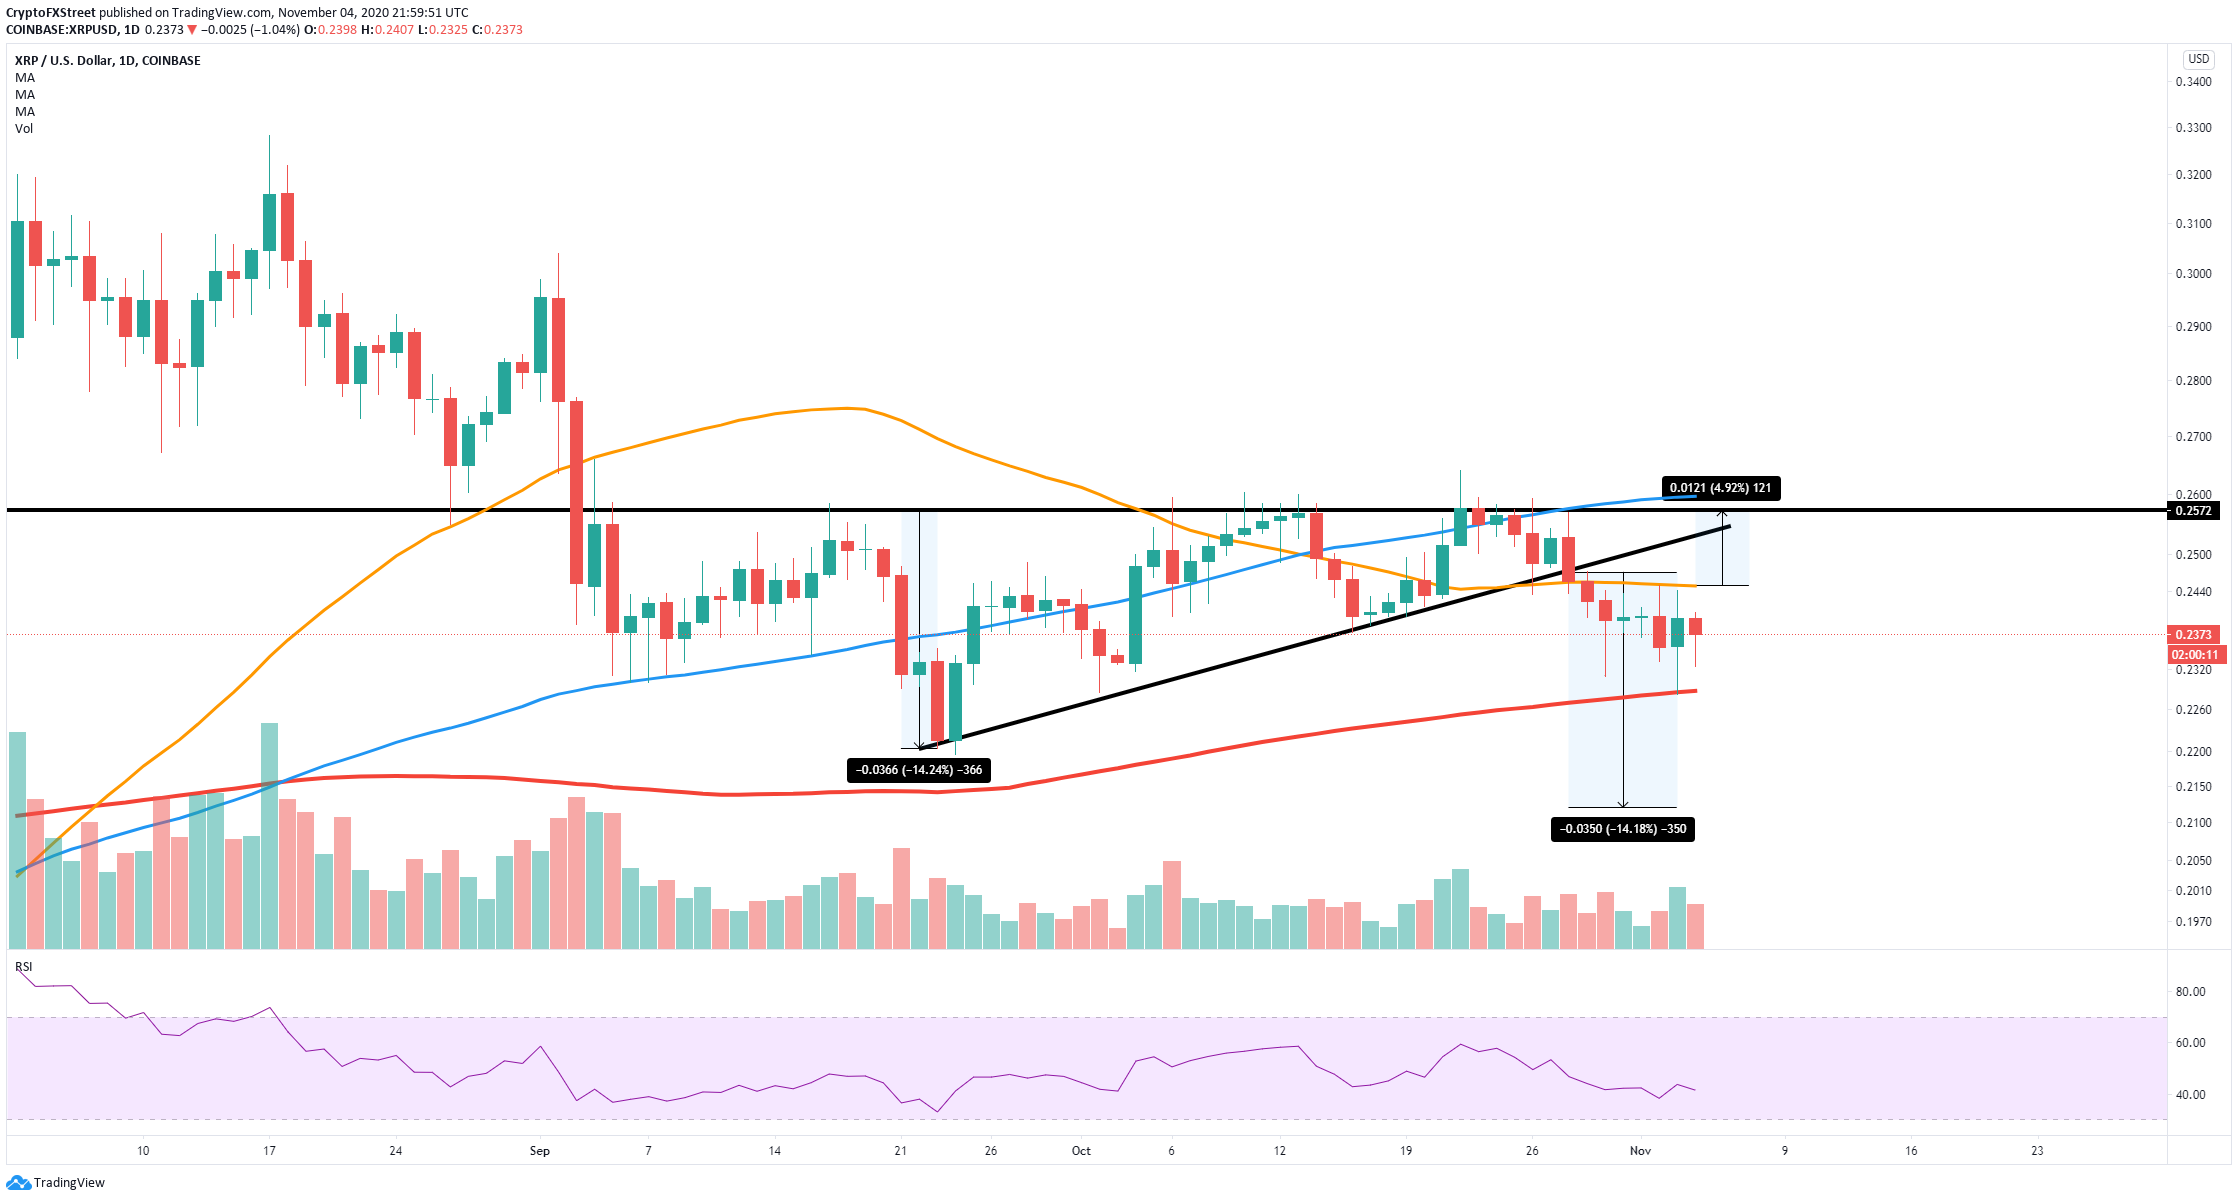
XRP/USD daily chart
The price has already tested this 50-SMA level two times before. A breakout from this point can easily drive the price of XRP towards the upper trendline of the ascending triangle at $0.257 which will continue to act as a resistance level.
%20%5B23.00.37,%2004%20Nov,%202020%5D-637401241992865855.png)
XRP holders distribution chart
On the other hand, another rejection can lead the digital asset towards its bearish target at $0.212 and potentially even lower. The 200-SMA at $0.228 is also a likely price target in the short-term.
Additionally, it seems that whales are exiting their XRP positions in the past two weeks. The number of holders with at least 10,000,000 coins was hovering at 313 throughout September and two-thirds of October. However, this number dropped significantly on October 24 to a current low of 305, indicating that whales are not that interested in XRP as prices continue declining.
