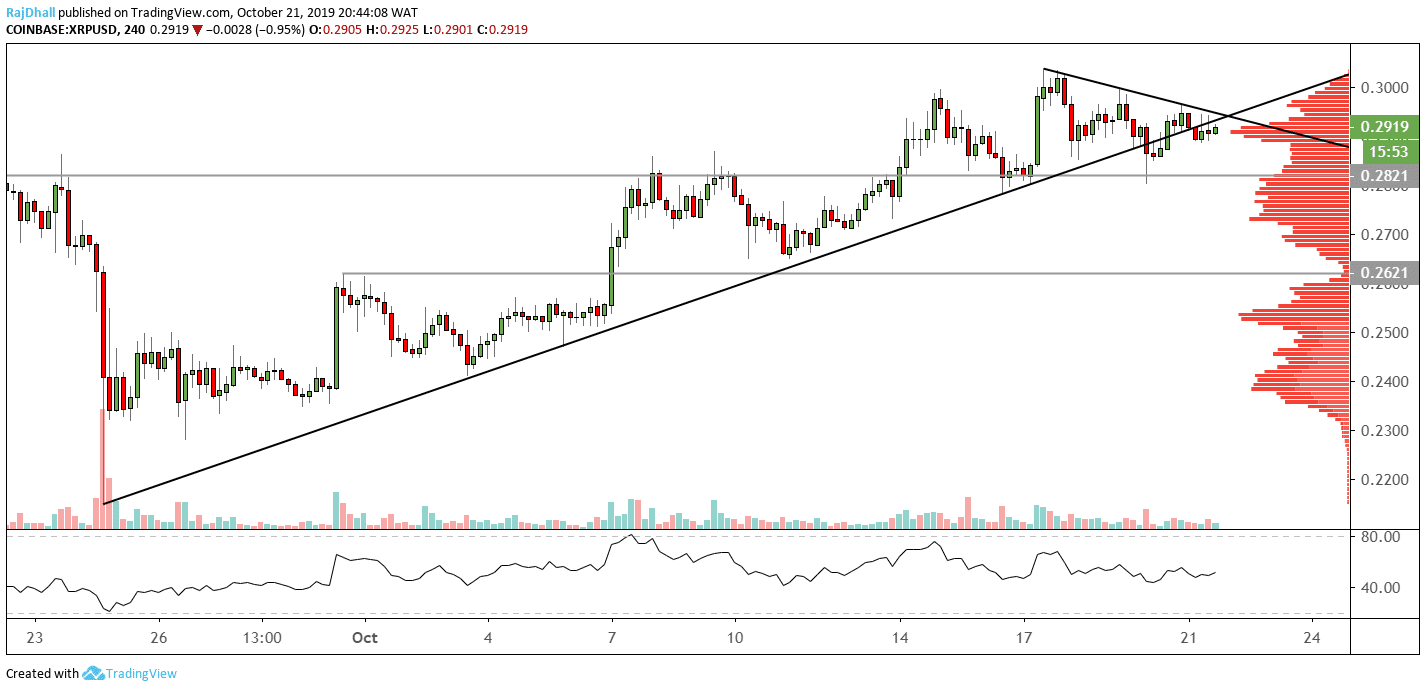
- XRP/USD has broken the trendline to the downside but the price is still in a technical uptrend.
- The 0.2821 support level is a strong one and has held firm in the past.
XRP/USD has been one of the darlings of the crypto market over the last few weeks rising 9.42% since 24th September.
The 0.3000 resistance level is proving to be a tough nut to crack for the bulls and if the XRP/USD is to push higher it needs to break the psychological level,
The relative strength index (RSI) is showing signs of a momentum drop off as the price made high highs the indicator made lower highs.
At the moment, on the four-hour chart, the candlesticks are showing signs of indecision as they are forming Doji candles.
Also, the trendline broke lower on 20th October. This proved to be a false break as the XRP/USD price moved back above the trendline.
Subsequently, the price broke back below and is now retesting the trendline which could indicate there might be a move lower on the cards.
For now, the main resistance is 0.3038 and the key support lies at 0.2821.