- XRP/USD trades 1.34% lower and has hit a strong resistance zone at 0.2850.
- There is also a trendline resistance zone at the same area which has halted any progress.
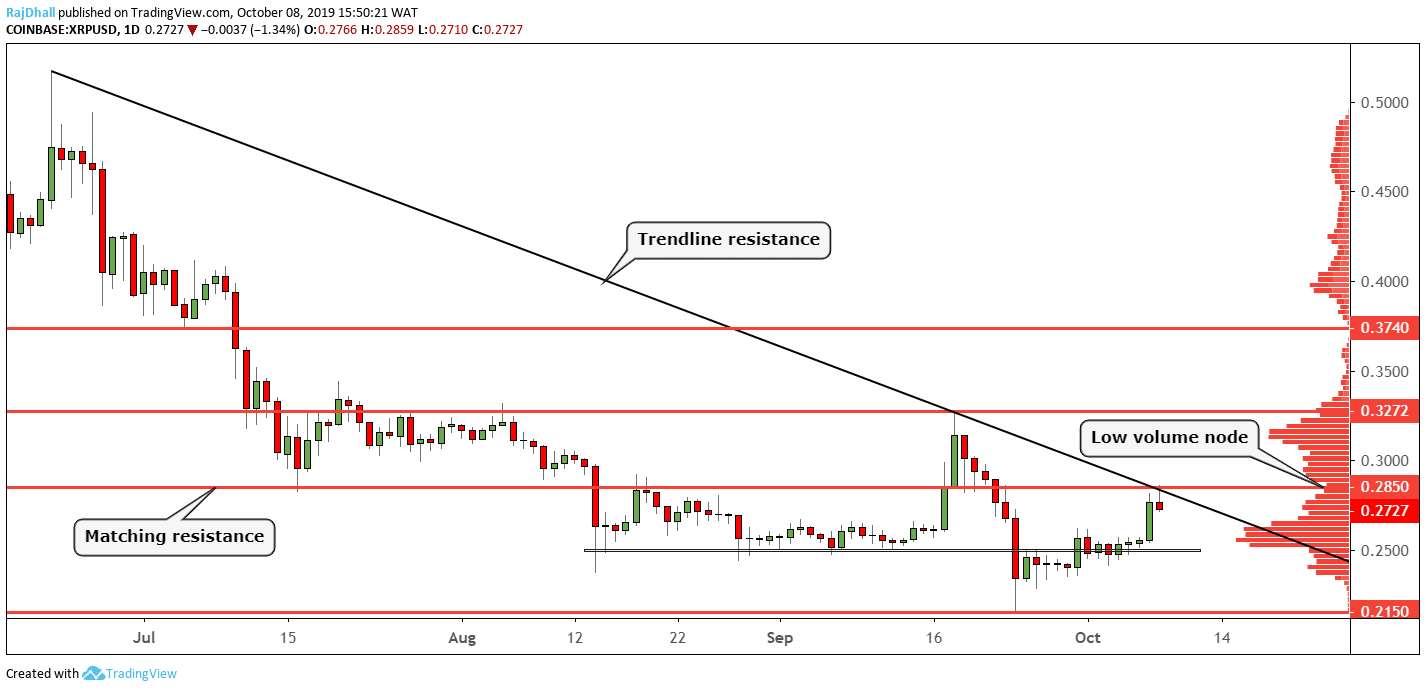
Technical analysis works amazingly on the crypto markets. On the daily chart below you can see there is a trendline that originated in June.
Today the price hit the trendline and bounced right off as it seemed to hold as a strong resistance point.
Incidentally, there is also a horizontal resistance line at 0.2850 that has used a few times in the past.
On the downside, if the bears regain control 0.2500 could come into focus once more.
If the trend is to change and move higher the level the bulls need to take out is 0.3272. On the volume profile indicator on the right-hand side of the chart, we are currently above the mean value area. This is represented by the bell curve with the biggest peak which is around 0.2560.