- Yearn.Finance price is contained inside a descending wedge on the daily chart.
- The digital asset faces very little resistance to the upside.
Yearn.Finance has been trading inside a descending wedge pattern since November 2020, slowly losing strength but gearing up for a potentially massive breakout. On-chain metrics suggest the odds of a breakout are high.
Yearn.Finance price has slowed down but on-chain metrics are favorable
On the daily chart, YFI has established a long-term descending wedge pattern and it’s close to a breakout above the resistance level at $24,700. Cracking this resistance point can quickly push YFI price towards $31,000.

YFI/USD daily chart
It seems that the number of whales holding between 100 and 1,000 YFI coins ($2,400,000 and $24,000,000) has increased significantly since November 2020, jumping from 27 to a current high of 41.
%20%5B21.31.55,%2006%20Jan,%202021%5D-637455620505797705.png)
YFI Holders Distribution chart
Additionally, the In/Out of the Money Around Price (IOMAP) chart shows very little resistance to the upside above $25,000 well until $29,000, but strong support in comparison from $24,700 until $22,618.
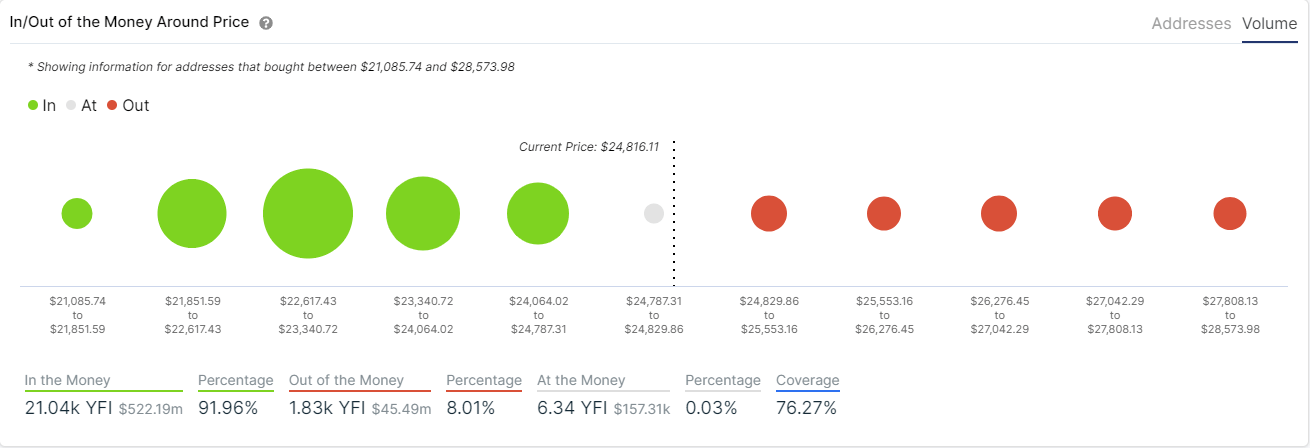
YFI IOMAP chart
However, despite all the good metrics, YFI is still facing a tough resistance level at $24,700. Rejection from this point can push Yearn.Finance price down to the most significant support area between $22,617 and $23,340 according to the IOMAP chart.
