- YFI price is currently bounded inside a symmetrical triangle on the 30-minutes chart.
- A breakout into either direction has the potential to push YFi 10%.
YFI has been one of the top performers in the market in the past week, reaching a peak of $29,890 on November 20. The digital asset is currently trading at $25,168 and seems to be on the verge of a breakout or breakdown.
YFI awaits a potential breakout in the short-term
YFI price is trading at $25,165 inside a symmetrical triangle formed on the 30-minutes chart. The upper trendline at $25,750 is the most significant resistance level currently. A breakout above this point would be notable.
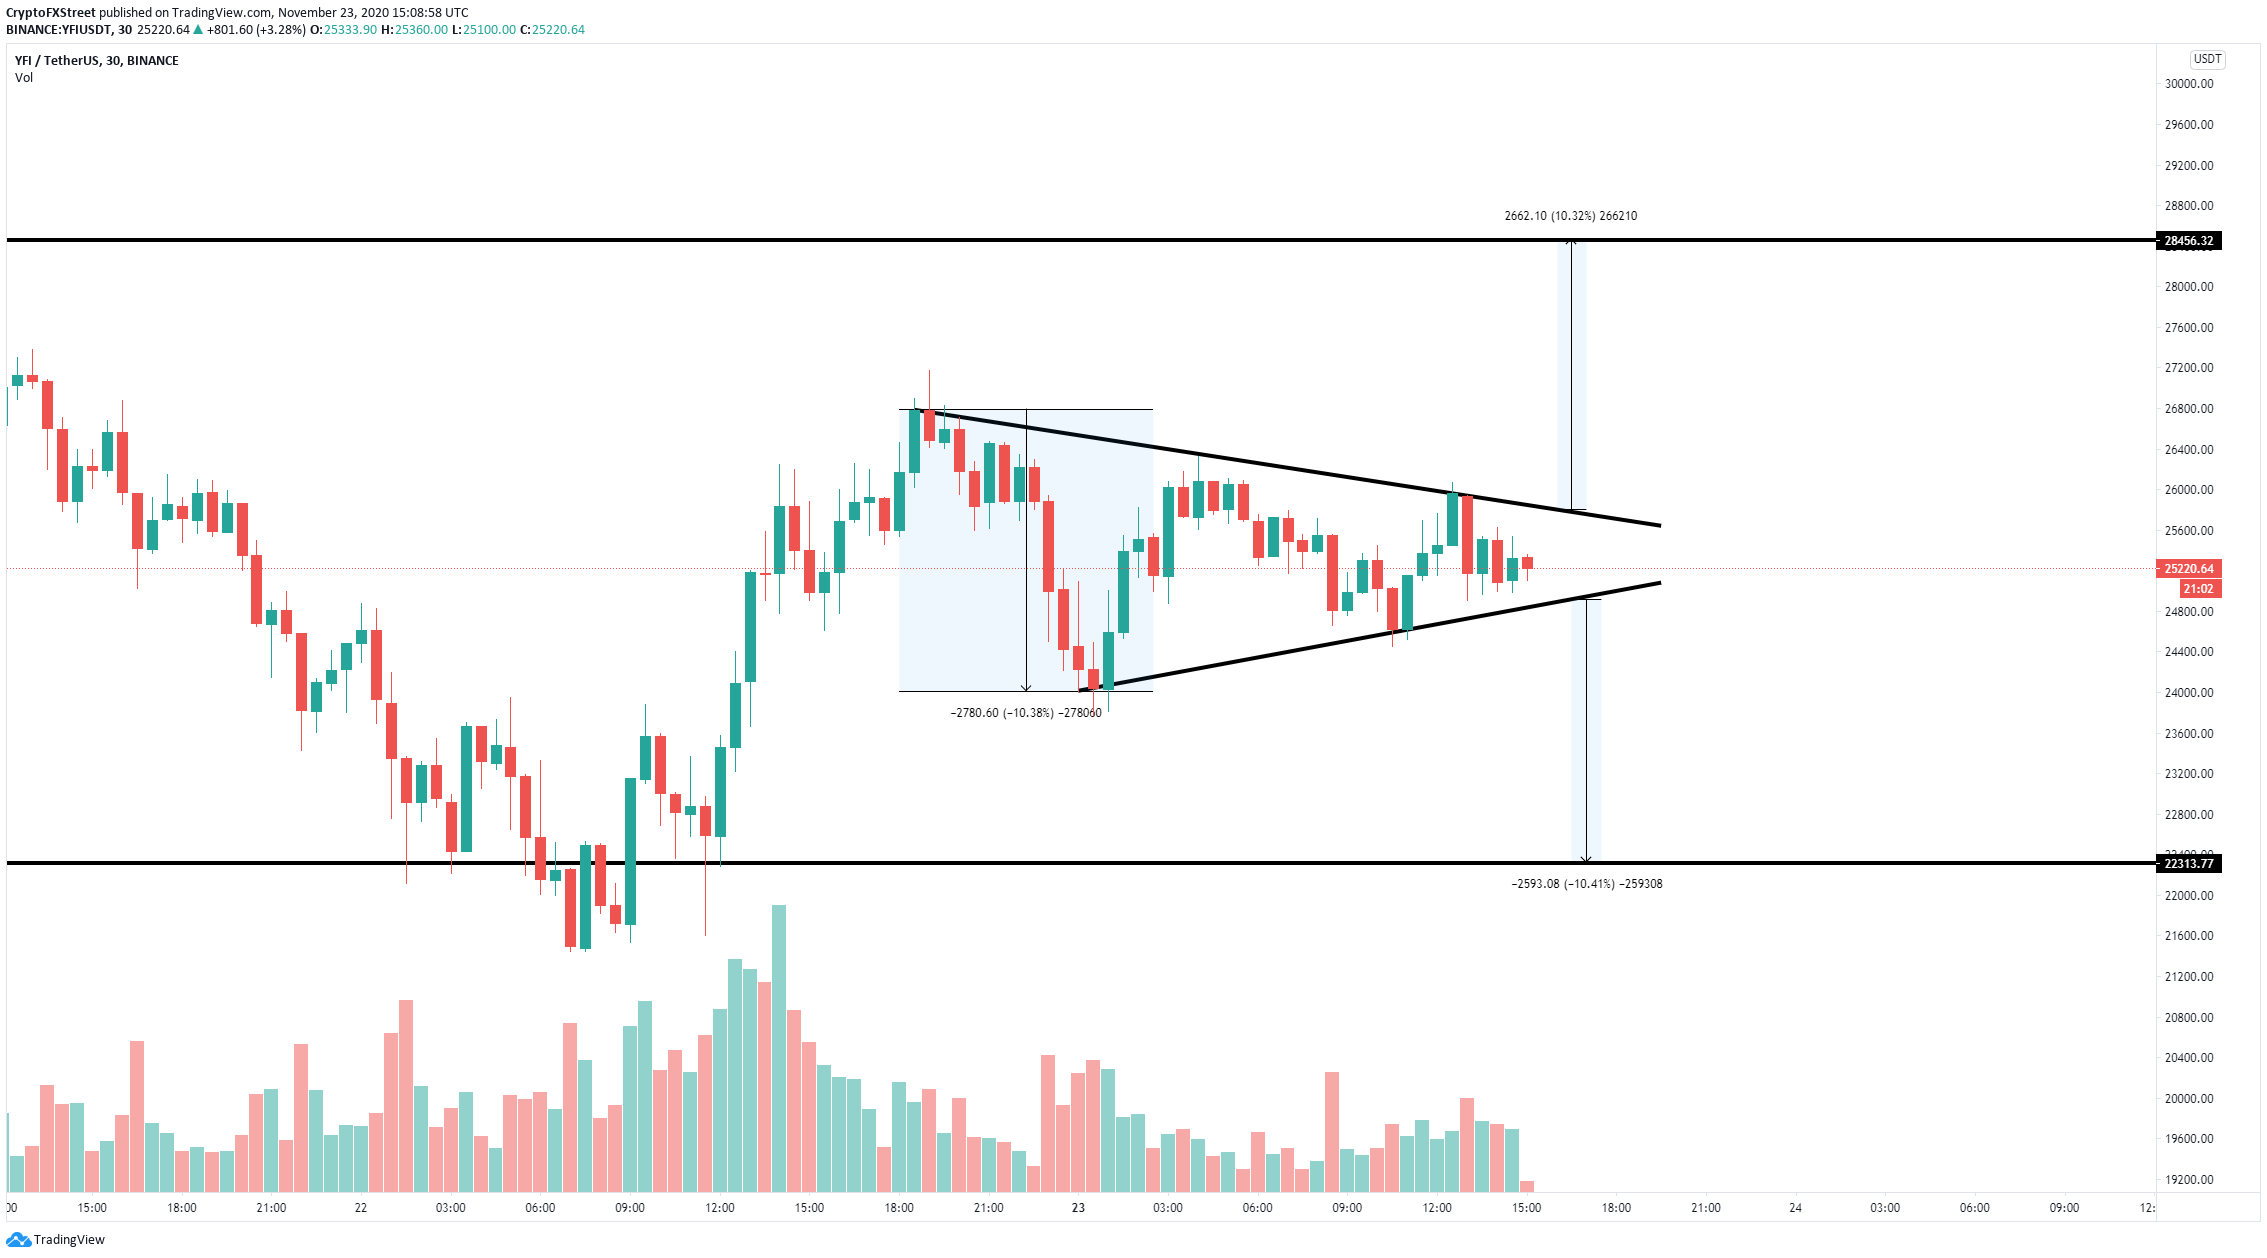
YFI/USD 30-minutes chart
Using the height of the symmetrical triangle, which is 10%, it can be determined that the bullish price target is $28,456, which would represent a similar price growth after a breakout above the resistance trendline at $25,750.
On the other hand, a breakdown below the lower trendline at $24,893 would quickly drive YFI price towards $22,313, which would also represent a 10% drop. YFI is right in the middle of the pattern currently.
