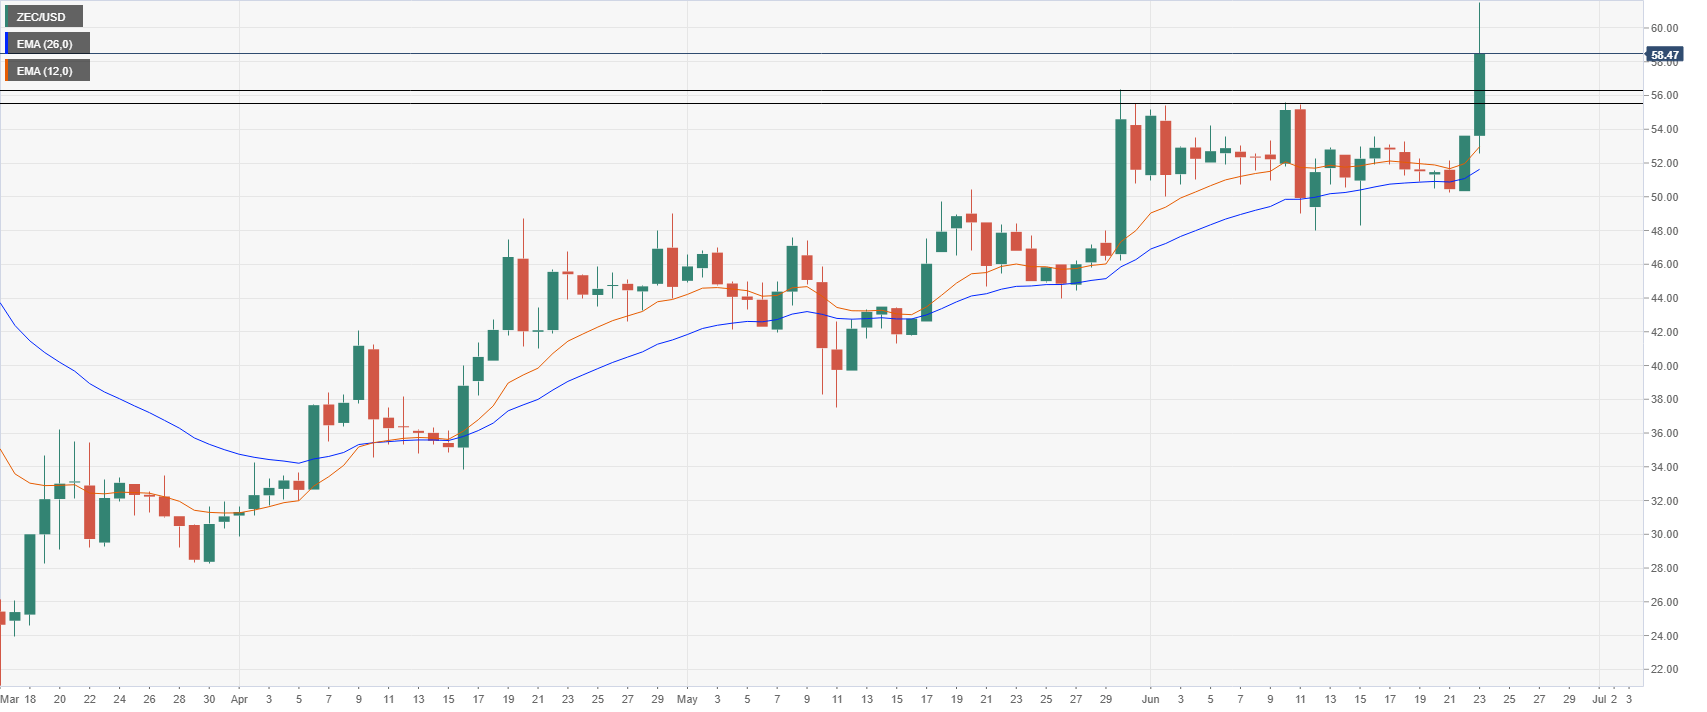
- ZEC/USD is up 9% in the last 24 hours after climbing above several daily resistances.
- Zcash has confirmed a daily uptrend.
Zcash is up 200% since March 13 but was slowing down significantly over the past three weeks. ZEC/USD was inside a daily downtrend after losing the 12-EMA and hitting a lower low at $48. On June 22, ZEC had an initial bull surge to $53.62 from a low of $50.3. On June 23, buyers followed up with more strength pushing Zcash above $60, hitting $61.54 before a mild pullback to $58.47.
ZEC/USD daily chart
On June 22, buyers pushed Zcash above both daily EMAs which have been bullish for months. On June 23, ZEC climbed above the resistance level at $55.56 and $56.33 and it’s not facing any more resistance until $64.24.
ZEC/USD 4-hour chart
Zcash is also in an uptrend on the 4-hour chart and has a clear path towards $60 and $64. For support, buyers can use the 12-EMA and the previous high of $56.33.

-637285340150365794.png)
