- Zilliqa price tagged the 2018 high this week.
- Daily Relative Strength Index (RSI) shows bearish momentum divergence.
- Deep range of support is just below current price.
Zilliqa price cleared the neckline of a massive head-and-shoulders bottom pattern in November 2020, resulting in a 630% rally at Monday’s high. This rally has captured support at the 50-day simple moving average (SMA) on every pullback over the last three months. However, all trends need a structural reset, and resistance at the all-time high will likely be the catalyst to initiate a deeper correction.
Zilliqa price correction will be cyclical, not secular
The bearish momentum divergence on the daily charts combined with a head-and-shoulders top pattern on the weekly RSI should raise caution amongst ZIL traders, despite trading near all-time highs. A break below the weekly RSI neckline will be the first confirmation that the correction is gaining traction.
ZIL has a range of support between $0.166 and $0.105 that encompasses the 50 and 100-day SMAs. If the advance is to follow historical precedent, the digital token should discover heavy support at the 50-day SMA, currently at $0.153. It would represent an 18.5% decline from the current price.
However, suppose ZIL is going to launch a successful rally above the all-time high at $0.235. In that case, price needs a deeper correction to hammer the RSI into an oversold condition, thereby generating a bull market reset. A fair target for a reset is the 100-day SMA at $0.117, producing a 38.5% decline from the current price.
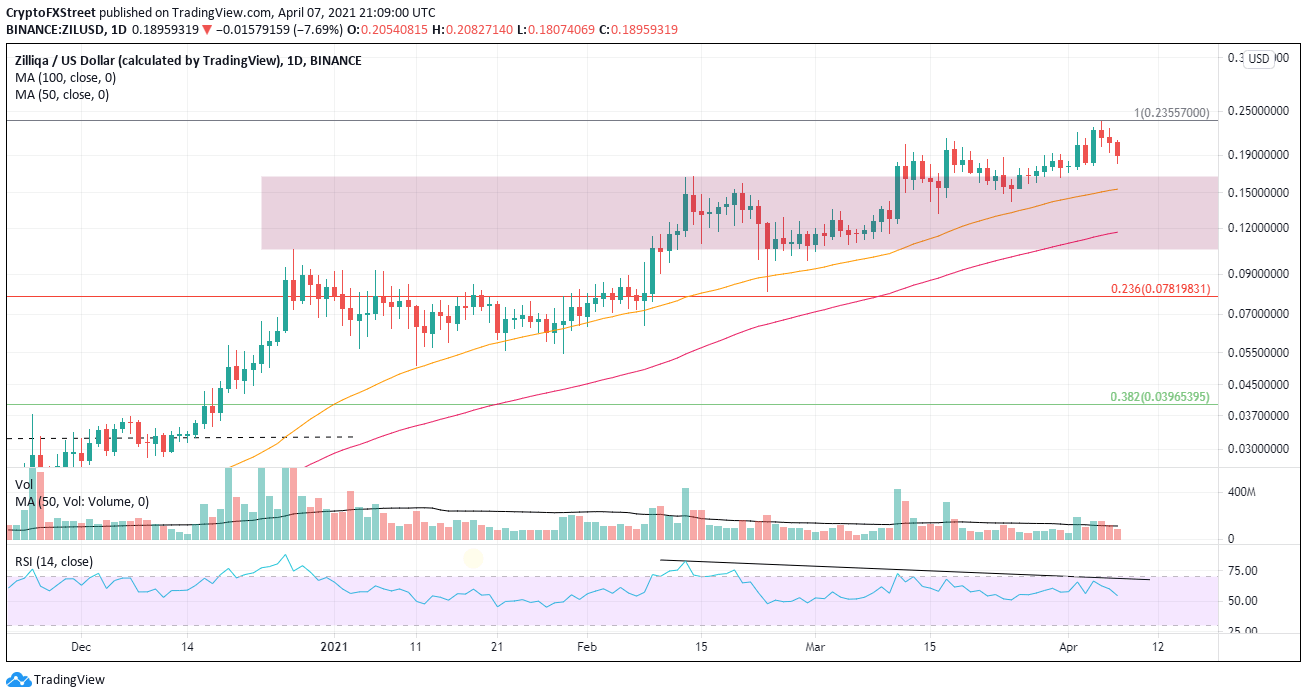
ZIL/USD daily chart
Cryptocurrencies have a unique volatility profile, and as a result, traders need to respect the alternative scenario for any market projection. In this case, ZIL may print a marginal new high, or it may define a tight pennant pattern just under the 2018 high, much like the price action of Cardano (ADA) at the time of writing.
Traders should evaluate upside targets after a weekly close above the all-time high at $0.235.
