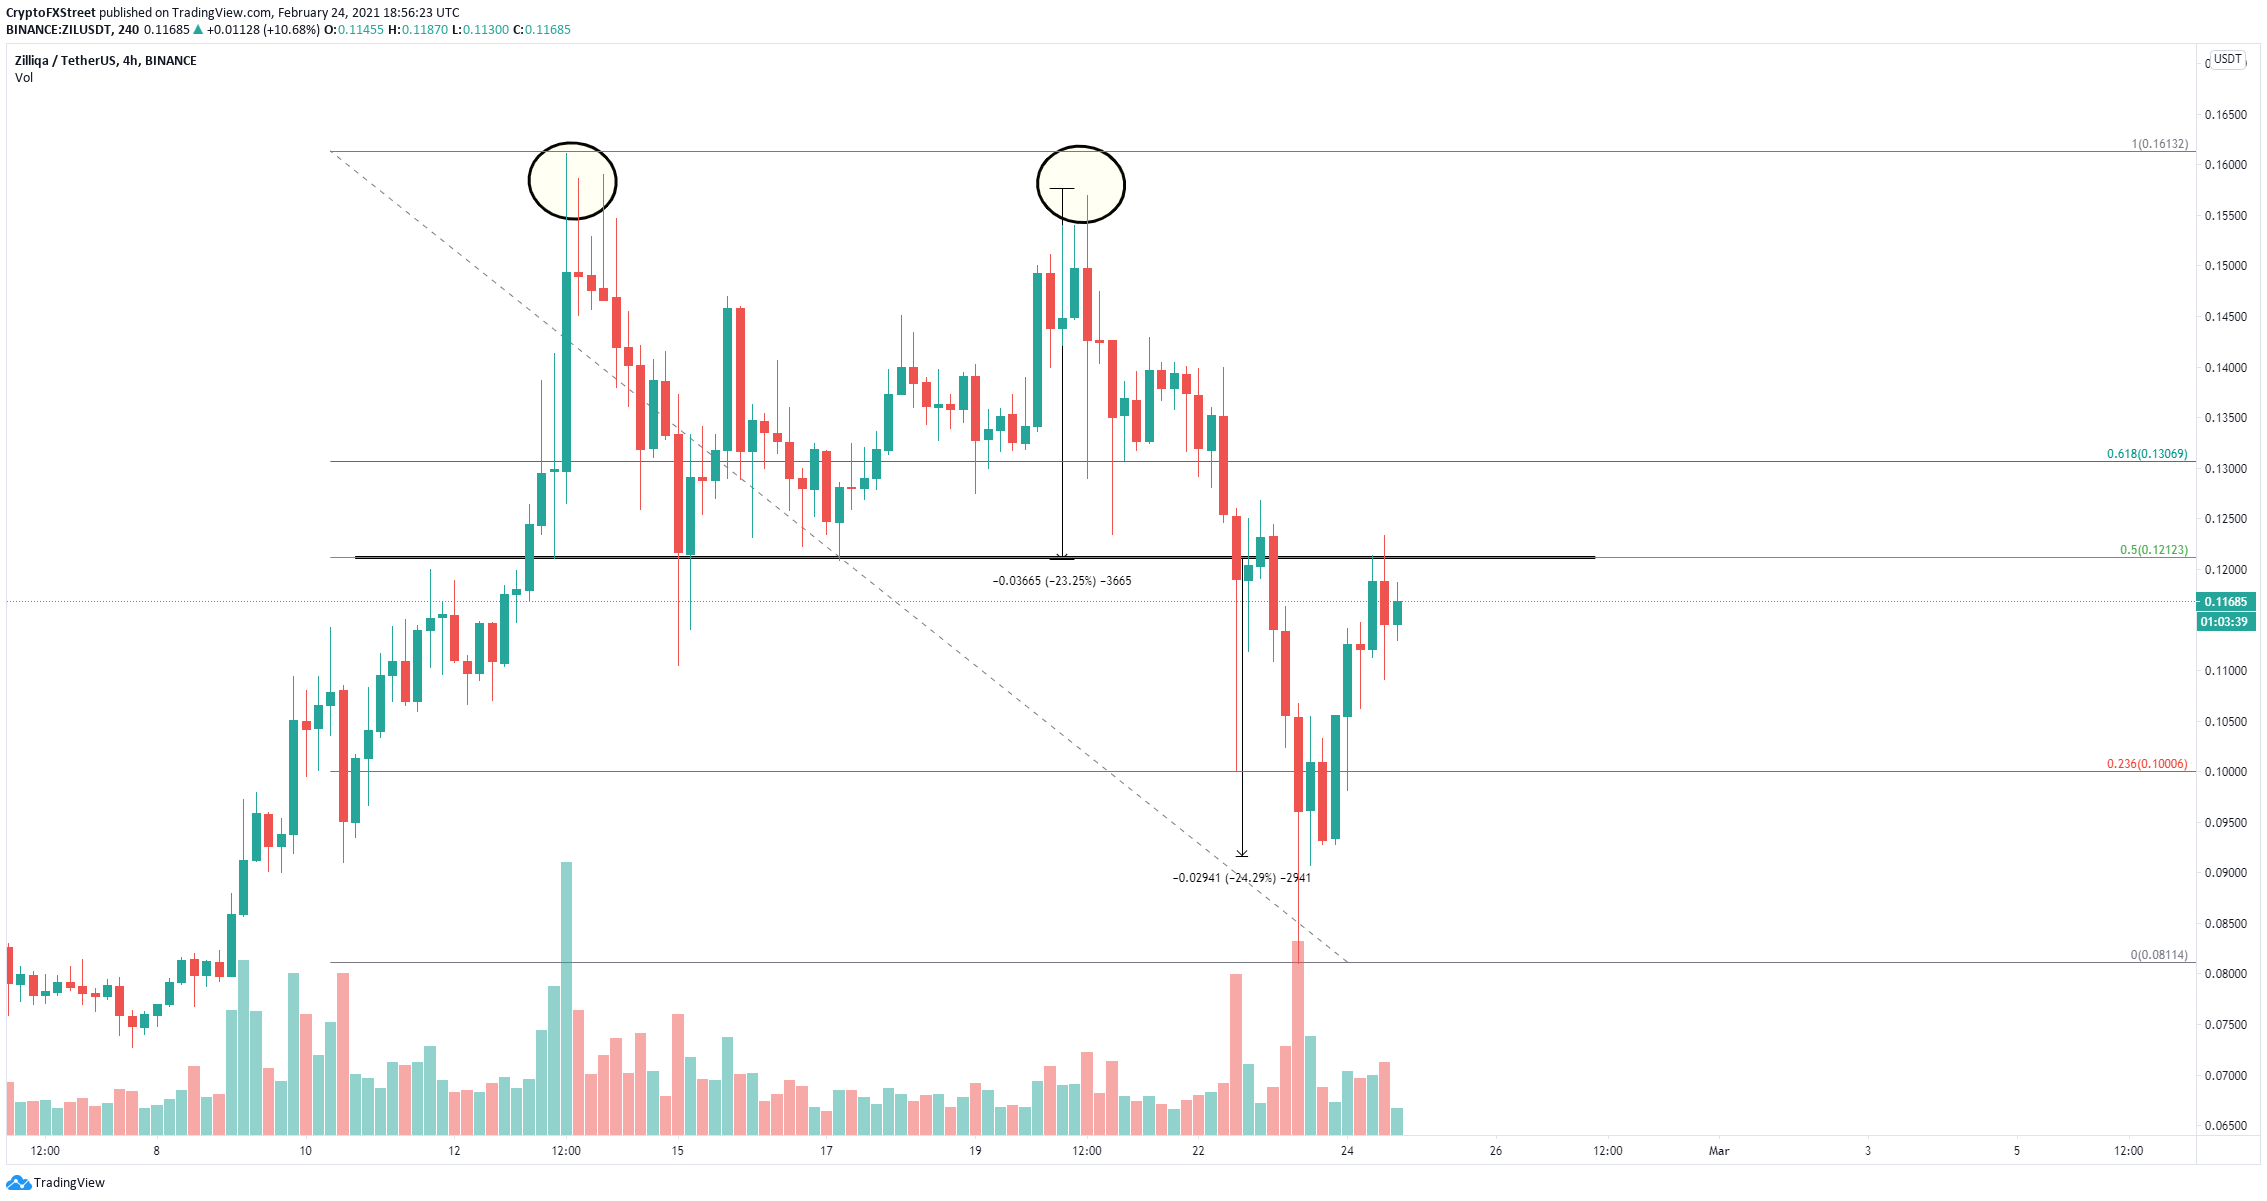
- Zilliqa price confirmed a double top pattern on the 4-hour chart.
- The digital asset broke the support neckline and had a 24% sell-off.
- The previous support is now acting as a strong resistance level.
Zilliqa price had a massive rally towards $0.161 on February 13 and topped out at $0.157 on February 20, forming a potential double top. This pattern was confirmed on February 23 after the bears broke the support neckline at $0.12 and had a ton of follow-through down to $0.09.
Zilliqa price faces significant rejection from key resistance level
The previous support neckline of a double top pattern will usually become a strong resistance point on the way up. Zilliqa price just got rejected from $0.121 and bear can see a lot of continuation.
ZIL/USD 4-hour chart
The 50% Fibonacci retracement level perfectly coincides with the key resistance level at $0.121 adding even more credence to the bearish outlook. The next potential bearish target is down at $0.10 and eventually the previous low of $0.08.
To invalidate the bearish outlook, ZIL bulls must climb above $0.121 and see a candlestick close on the 4-hour chart. The next barrier is located at $0.13, which is the 61.8% Fibonacci level before a jump towards $0.16.

