- Zilliqa price is contained inside a symmetrical triangle pattern.
- The digital asset is on the verge of a massive 25% breakout.
- The bulls need to push ZIL above a key resistance level at $0.118.
Zilliqa price has been trading sideways for the past week, but recent developments suggest that the digital asset is ready for a bullish breakout towards $1.5.
Zilliqa price on the brink of a 25% jump
On the 4-hour chart, the most critical pattern formed is the symmetrical triangle, which is on the verge of a breakout if bulls can push Zilliqa price above $0.118.
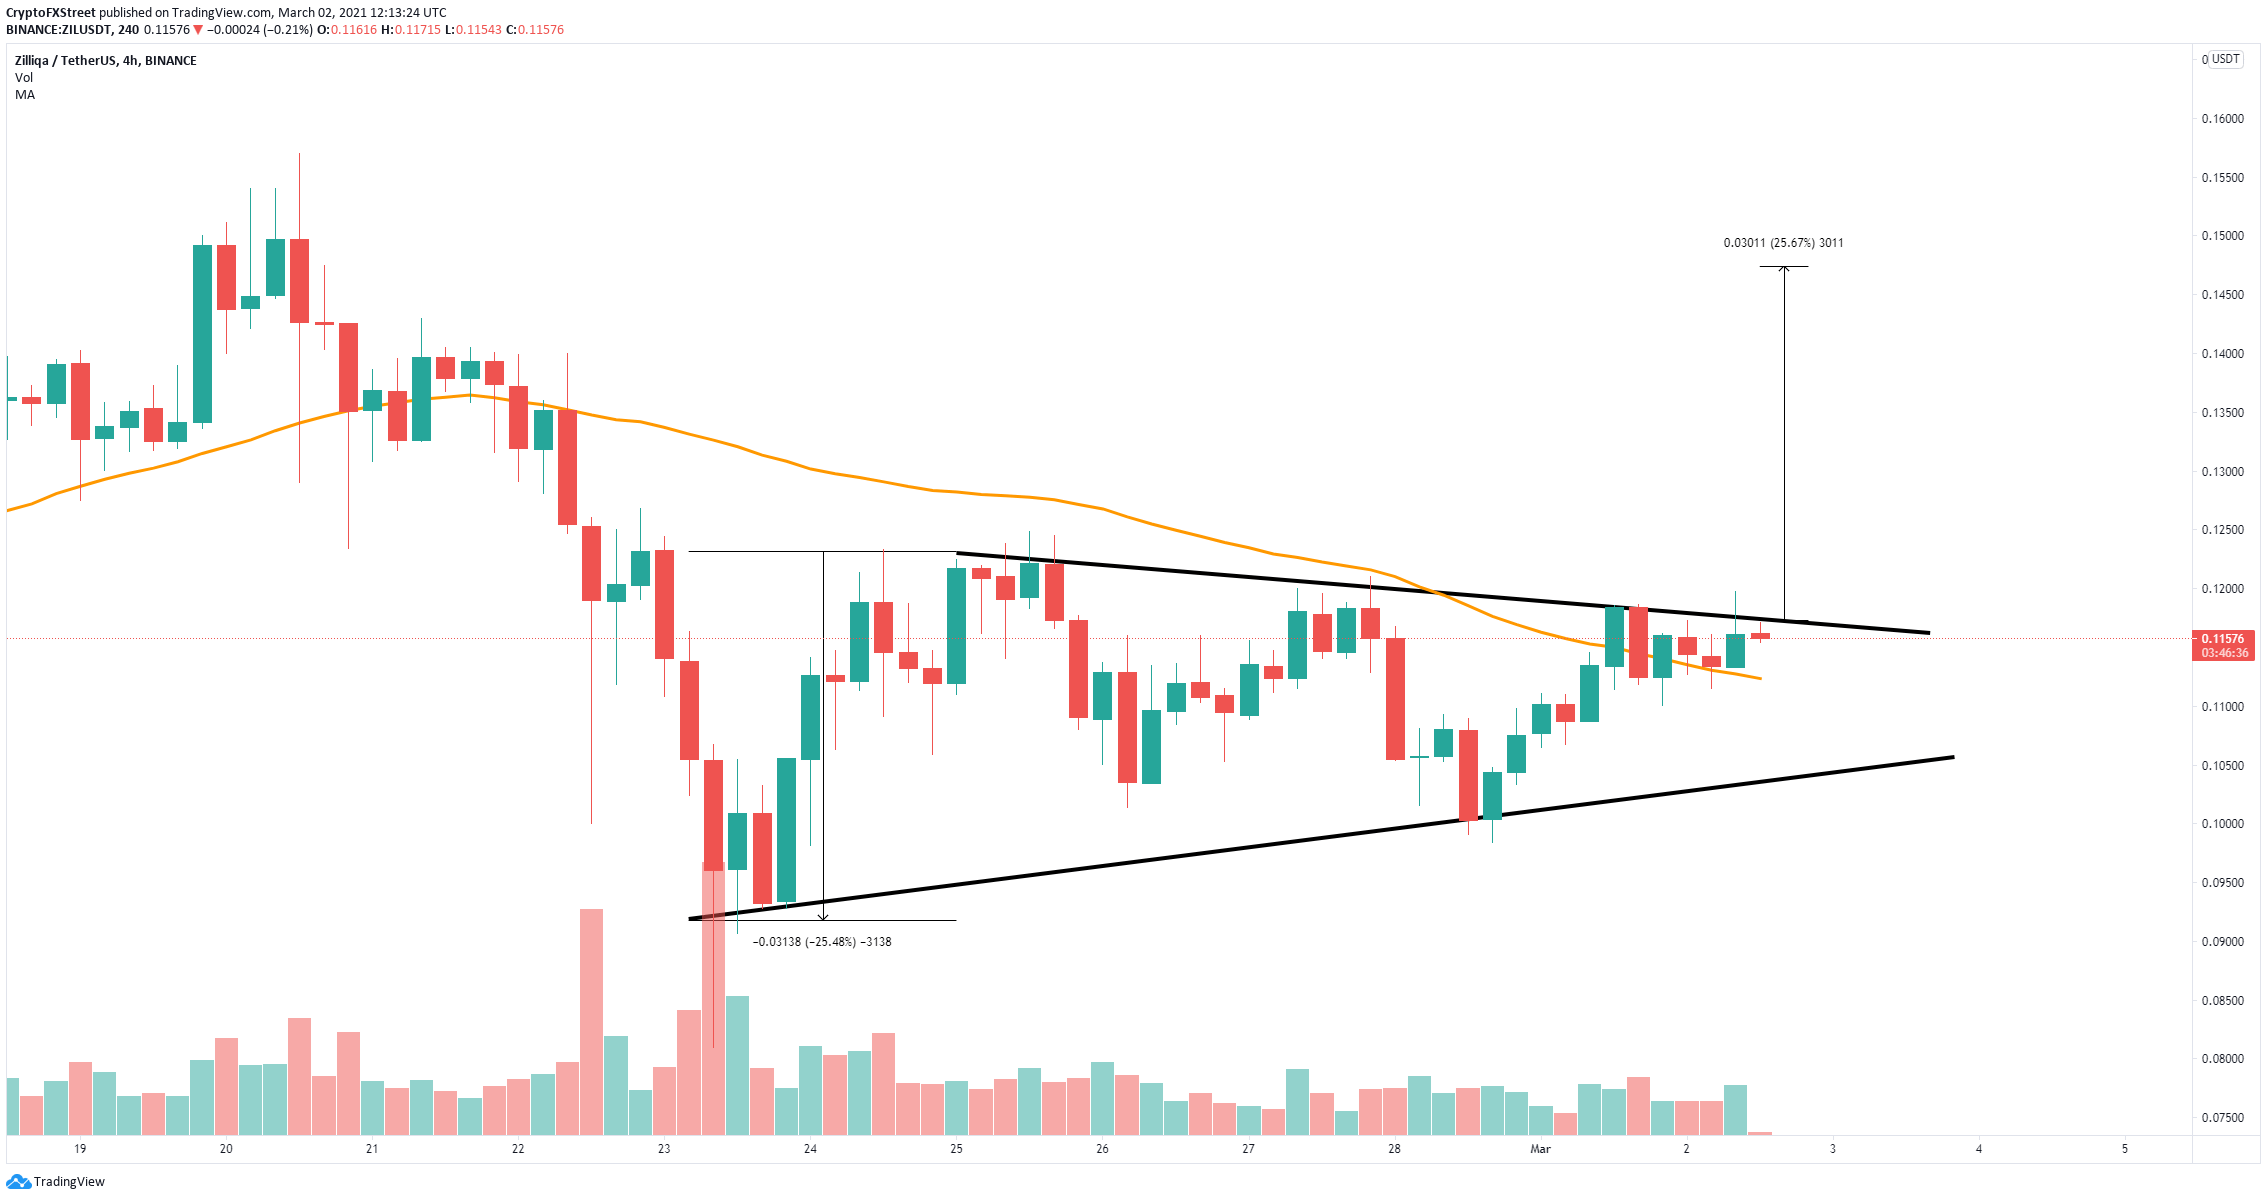
ZIL/USD 4-hour chart
The momentum seems to favor the bulls after Zilliqa reconquered the 50-SMA level as a support. A breakout above $0.118 would drive Zilliqa price towards a high of $1.5, a 25% move.
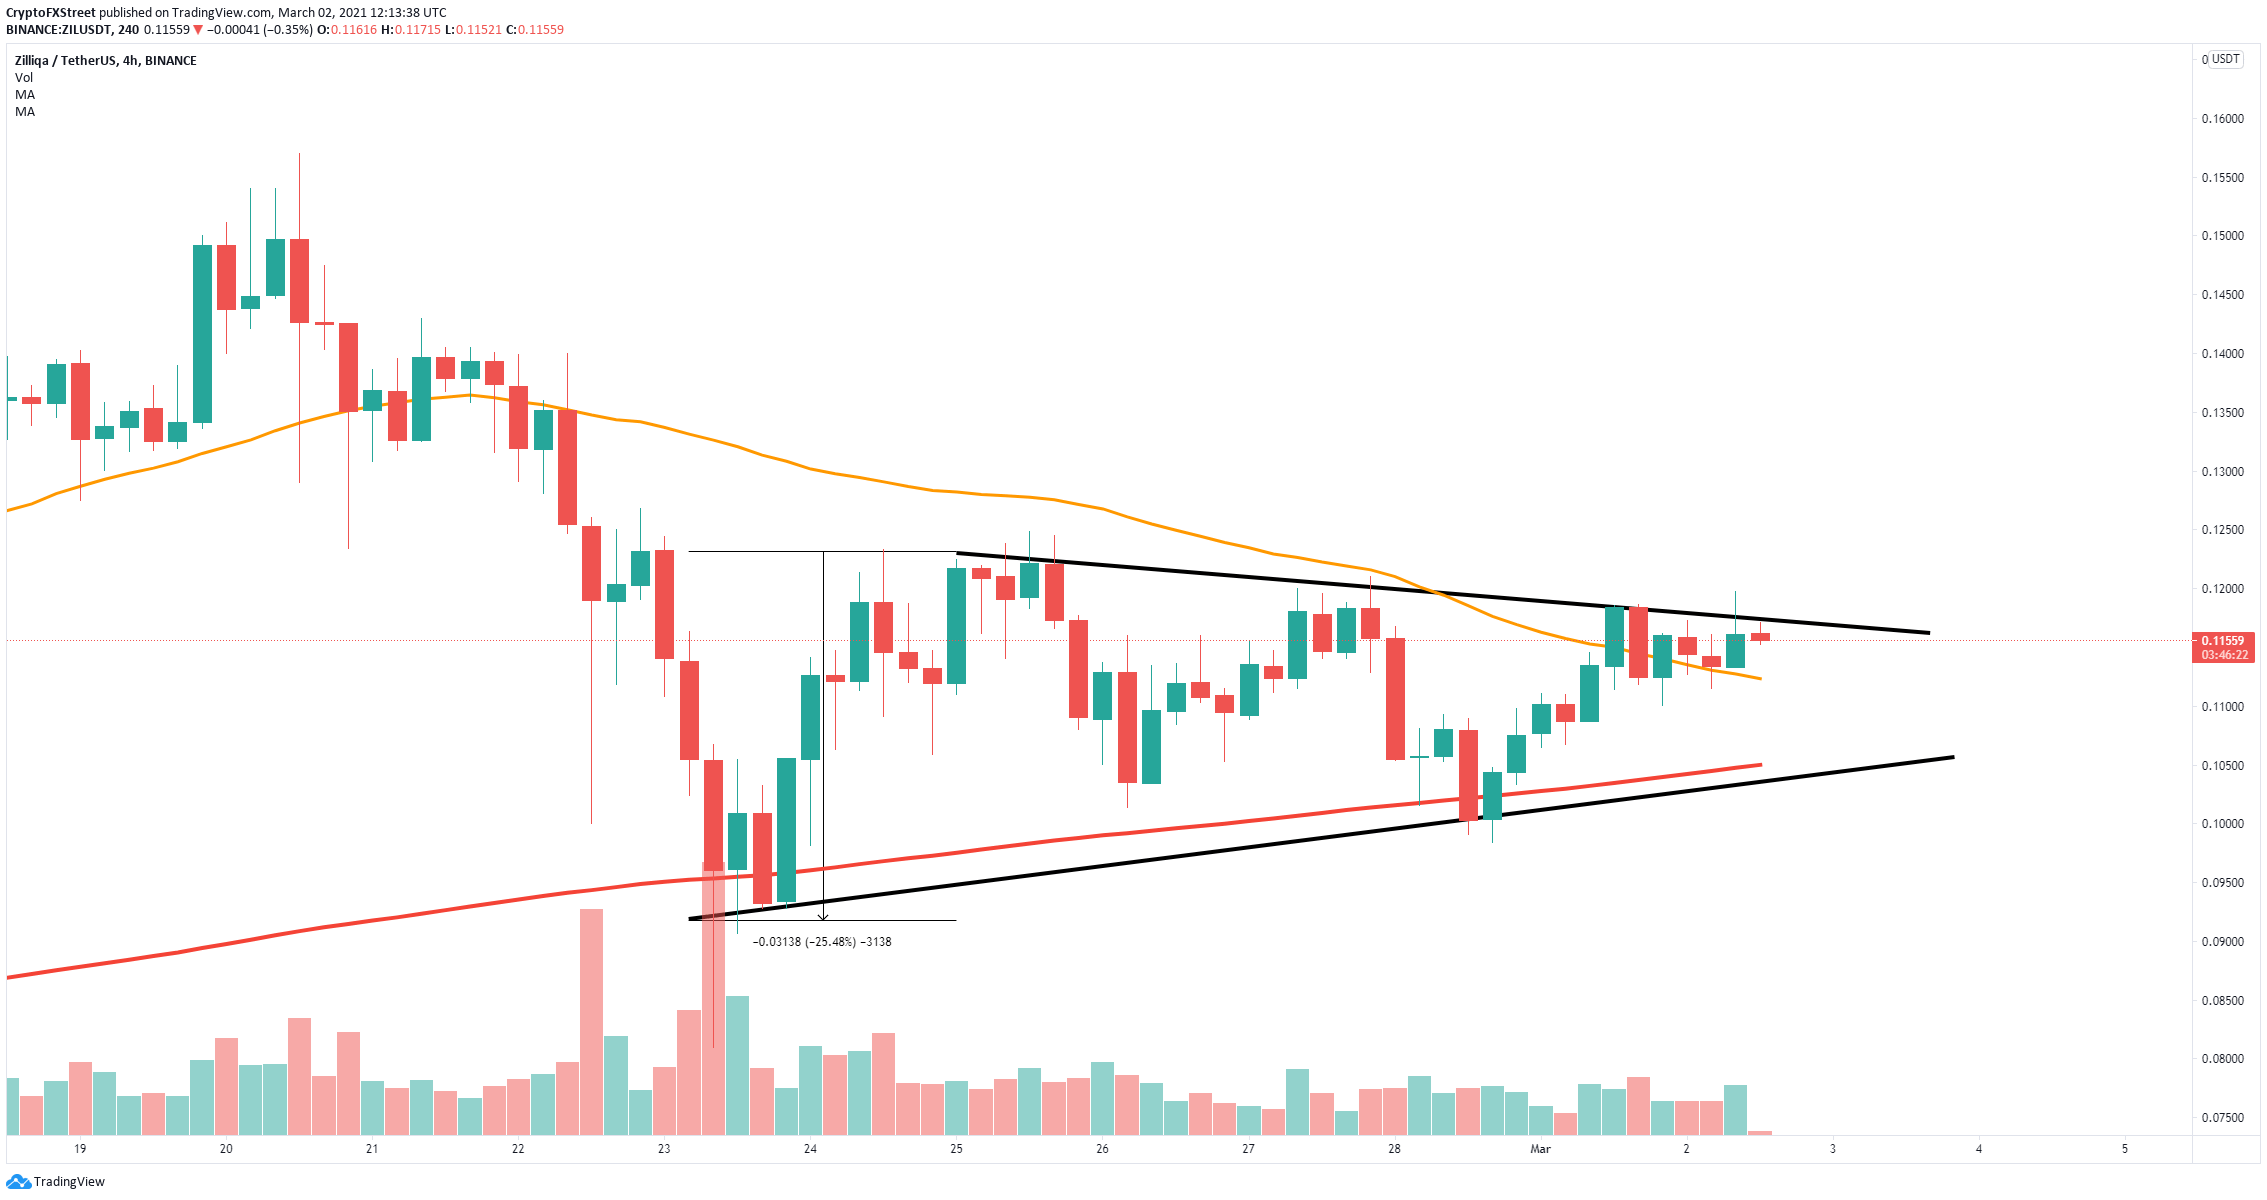
ZIL/USD 4-hour chart
On the other hand, the bears try to drive Zilliqa price below the 50-SMA support level at $0.112, which would push the digital asset down towards the lower trendline support and the 200-SMA at $0.105.
