- Zilliqa price is releasing from a bear flag pattern on the weekly chart, implying a substantial decline.
- The March 2020 rising trend line has been reliable support on a weekly closing basis.
- ZIL 10-week simple moving average (SMA) is trending downward, creating a headwind for future price strength.
Zilliqa price rests below the 200-day SMA and near the March 2020 rising trend line. The breakdown from a bear flag continuation pattern focuses on the 23.6% Fibonacci retracement level, the 50-week SMA and the May low. A failure to hold the May low may unleash a considerable ZIL decline.
Zilliqa price chart discloses some encouraging support
Zilliqa price declined over 70% from the all-time high of $0.262 to the May 23 low of $0.069. The remarkable drop followed multiple frustrating attempts to overcome the 2018 high of $0.235, resulting in a double top that loudly triggered on May 19 with a drop below $0.115.
Zilliqa price identified support at the 50-week SMA before rebounding back above the March 2020 rising trend line and the 23.6% retracement level at $0.085 by the end of the week.
Over the last two weeks, Zilliqa price wedged higher, forming a bear flag pattern that triggered this week with a decline below $0.116. ZIL has since recognized support near the 23.6% retracement but still hovers below the March 2020 rising trend line currently at $0.100.
The bear flag continuation pattern’s measured move is roughly 65%, potentially pushing Zilliqa price down to $0.040. It would be a headline-worthy plunge, frustrating believers in the decentralized application-focused blockchain platform. At completion, ZIL would be trading below the 38.2% retracement of the 2020-2021 advance at $0.042 and just above the neckline of the 2018-2020 inverse head-and-shoulders pattern.
Without a weekly close below the March 2020 trend line at $0.100, Zilliqa price will be exposed to further oscillations around the 200-day SMA at $0.120, preserving an erratic period for ZIL market operators.
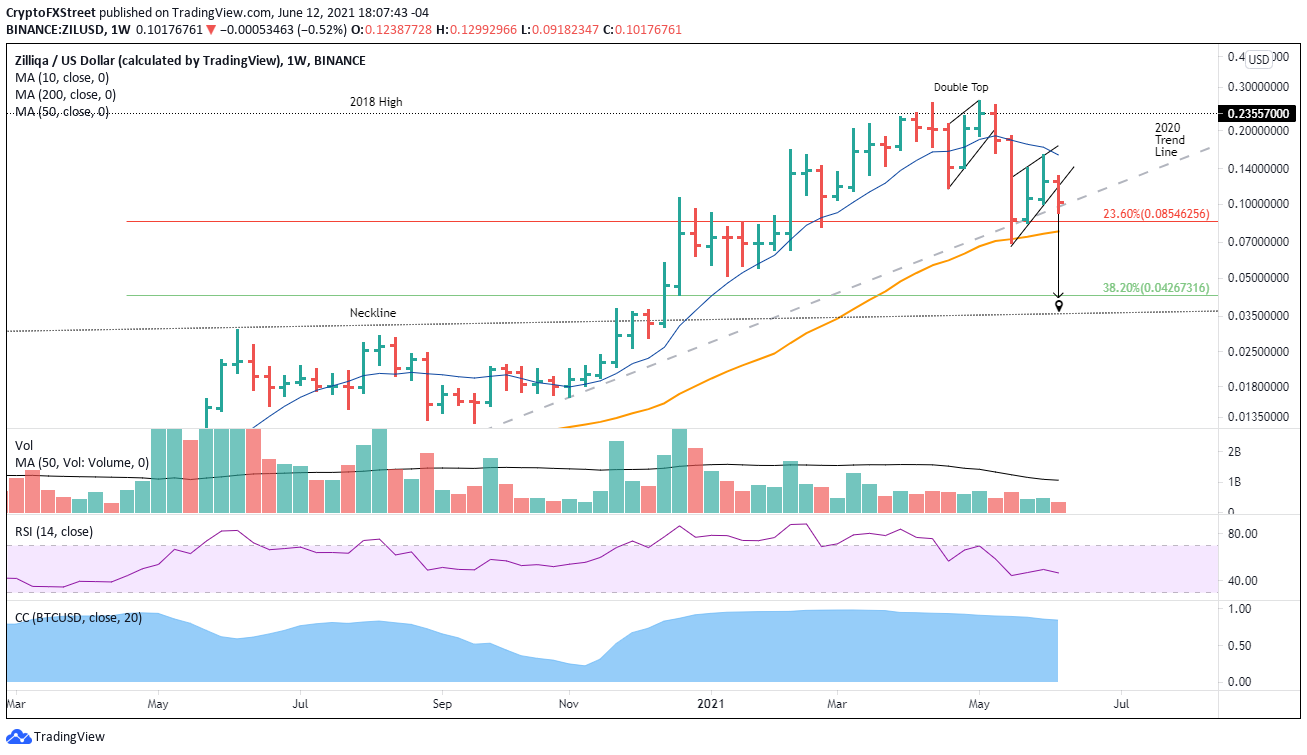
ZIL/USD weekly chart
To void the bleak outlook presented by Zilliqa price, ZIL would need a 20%+ gain from the current price and a weekly close above the flag’s lower trend line at approximately $0.119.
The Zilliqa price chart, like other altcoin charts, is illustrating a bearish outlook. However, with the precise, persuasive levels of support and resistance outlined above, ZIL investors are equipped to avoid the panic and financial devastation that would accompany a 65% decline.
