- Zilliqa price hints at another 30% rally after a breakout from a bull flag pattern.
- A breach of a critical supply barrier at $0.085 has opened up ZIL for a quick surge to $0.12
- On-chain volume and developer activity add credence to its bullish thesis.
Zilliqa price has increased nearly 240% between December 12 and 27, 2020. This massive parabolic rally ended as the price slid into a consolidation pattern.
Zilliqa price on a freeway to $0.12
Pausing its recent rally, ZIL was consolidating in a symmetrical triangle. Such technical formation was part of a bull flag that projects a 70% target.
Thus far, Zilliqa price has surged 30% since it broke out of the bull flag in the 12-hour chart. This leaves the possibility for another 30% rally on the table. The SuperTrend indicator indicated a buy signal on January 30 and added to the token’s bullish scenario.
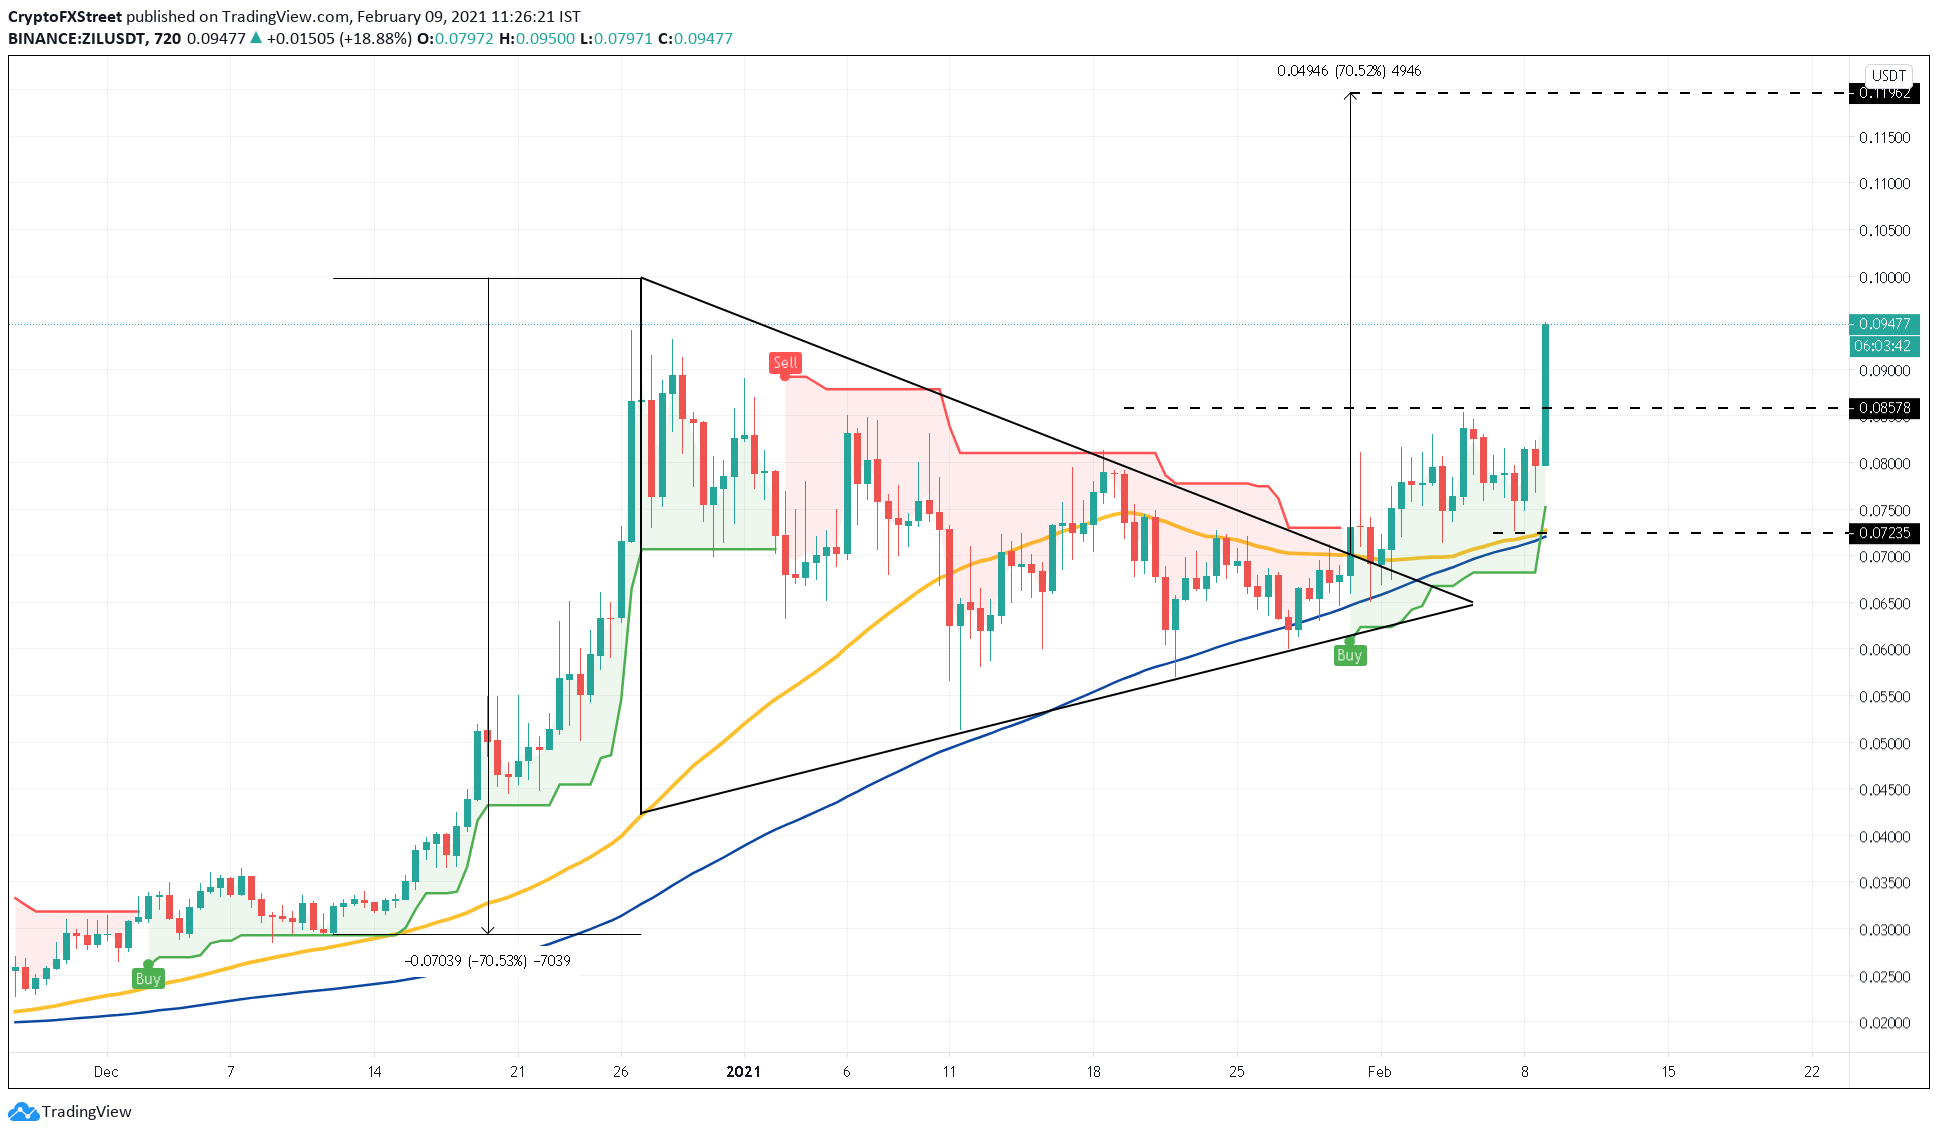
ZIL/USDT 12-hour chart
At the time of writing, Zilliqa’s on-chain volume noticed a 96% increase from $101 million to $197 million since February 7. The dramatic rise in this metric further validates ZIL’s bullish thesis.
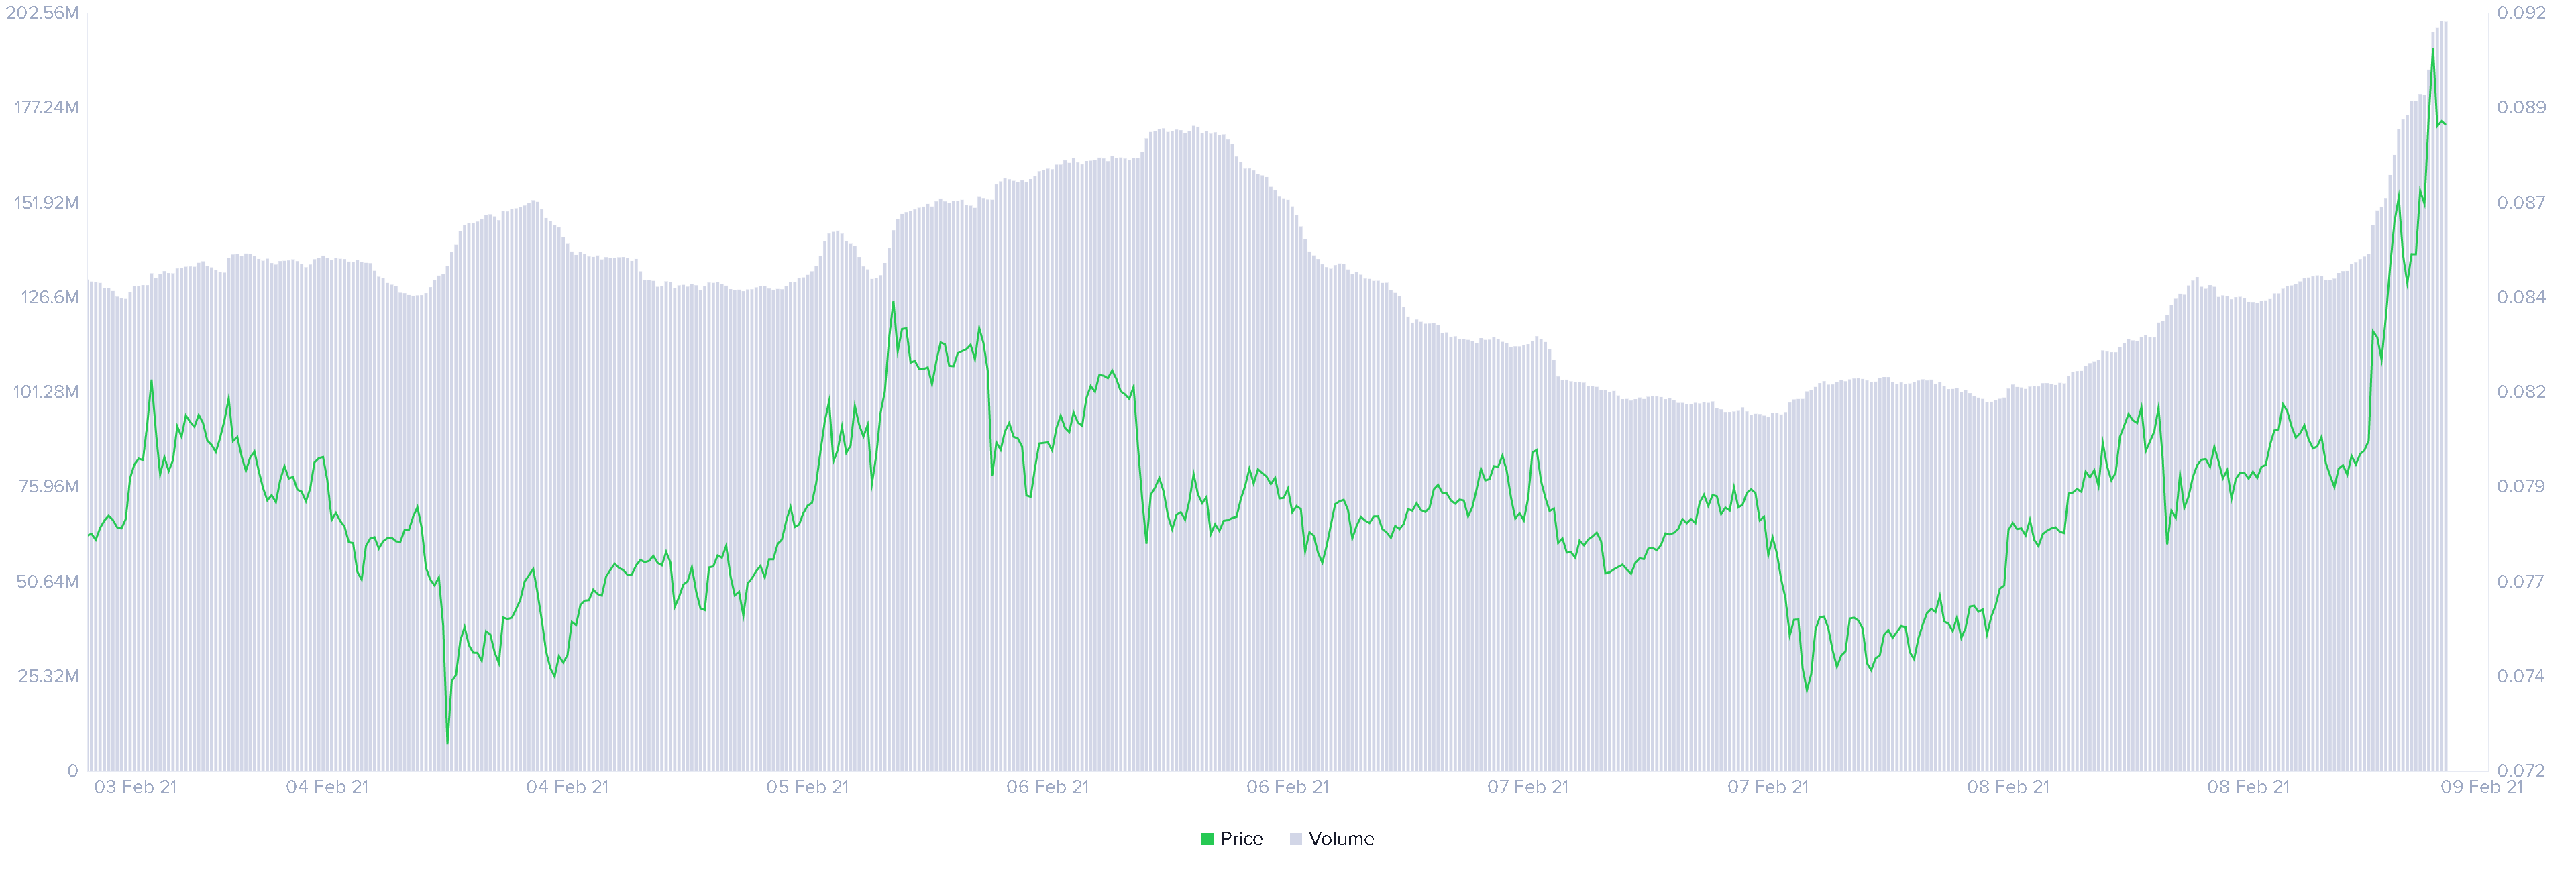
Zilliqa on-chain volume chart
Additionally, Zilliqa’s development activity surged by 50% from 0.36 to 0.54, while prices rose by 12% from $0.080 to $0.090. Usually, investors tend to associate a spike in development activity with the new update rollouts or announcements, which can help Zilliqa price advance further.
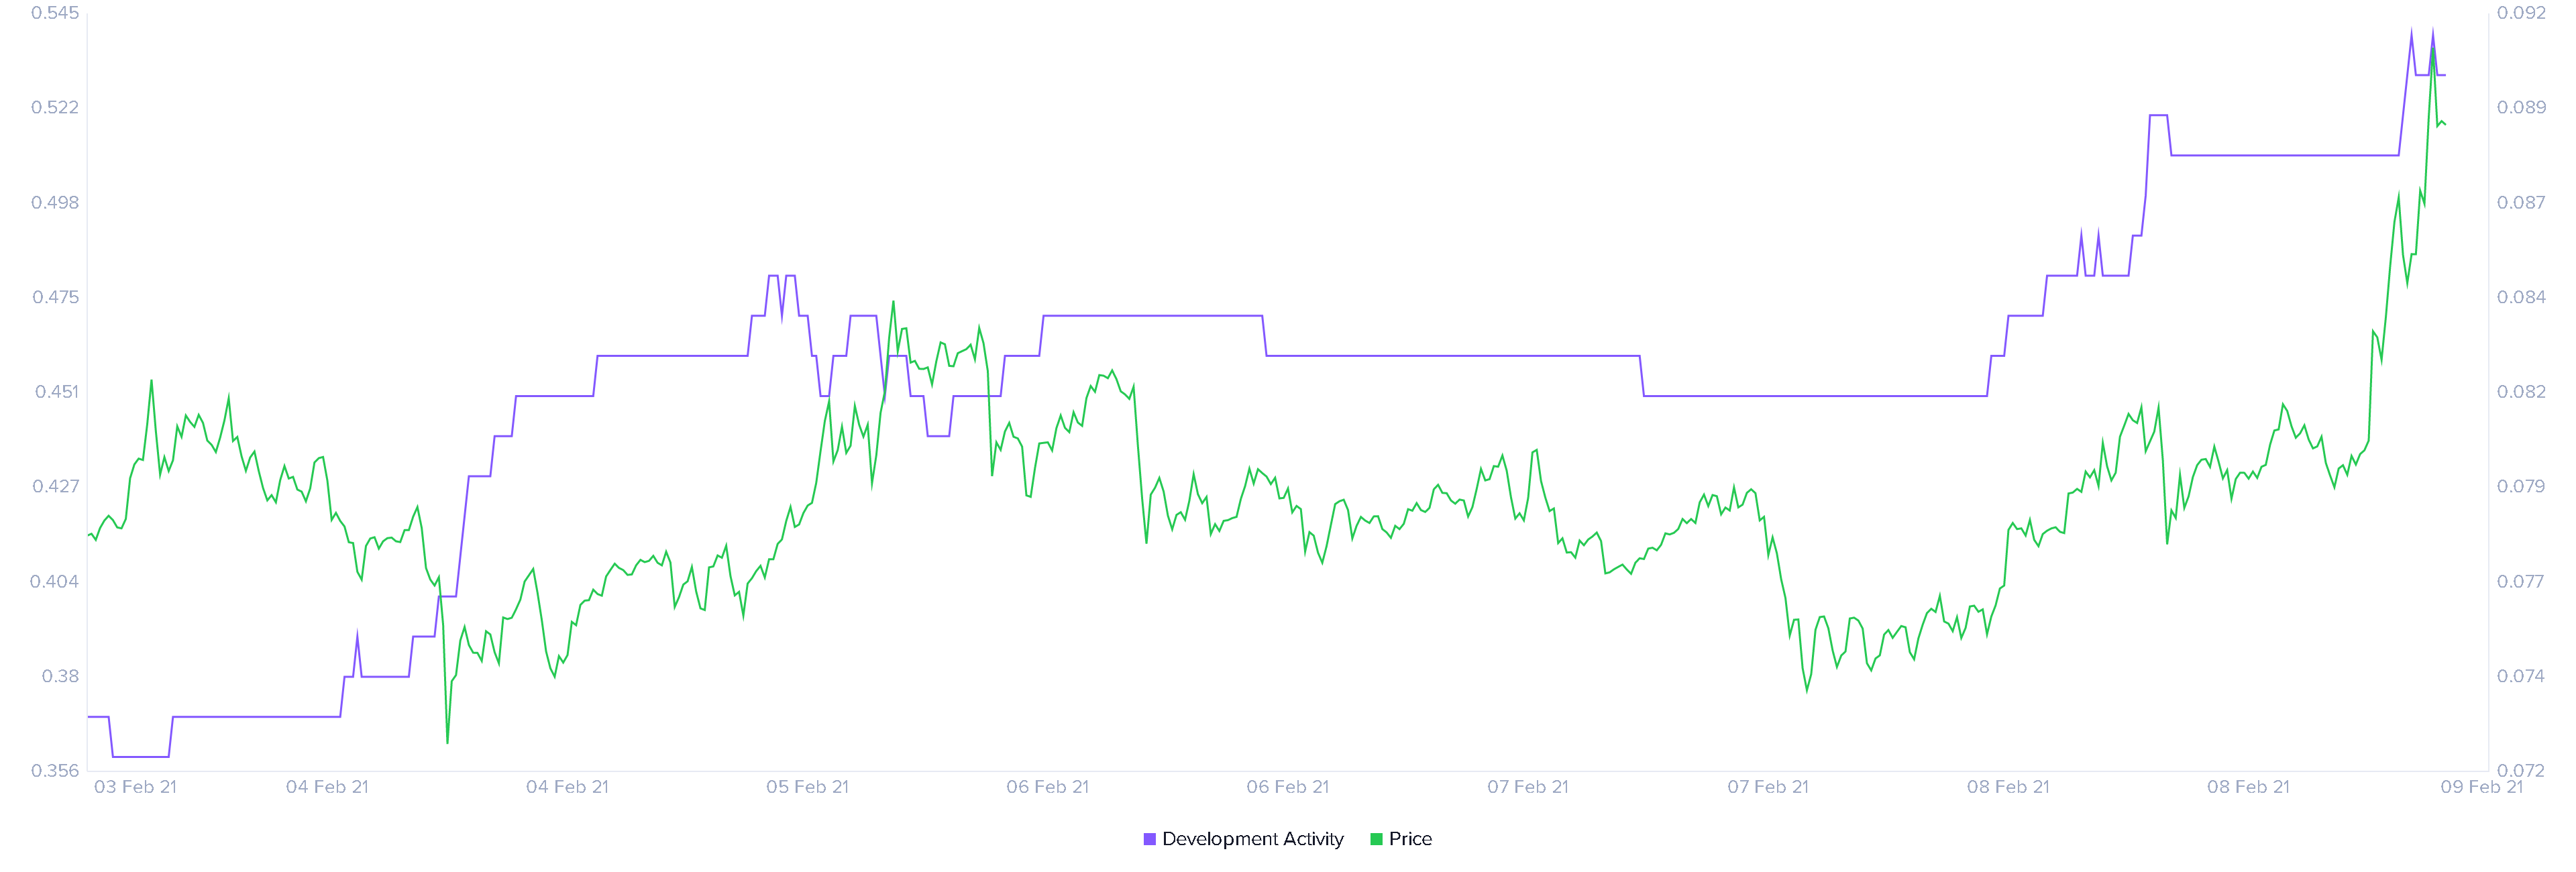
Zilliqa developer activity chart
Despite the overwhelming bullish indications, a breach of the immediate support at $0.085 could invalidate ZIL’s bullish thesis and trigger a sell-off. The resulting downswing could send the price down towards a confluence of support around 50 and 100 twelve-hour MA at $0.072.
