- Zilliqa price has seen a significant breakout from a descending triangle pattern on the daily chart.
- ZIL bulls aim for a 40% move towards $0.10 in the longer-term.
- On-chain metrics suggest that Zilliqa can climb higher without any barriers ahead.
Zilliqa had a massive run towards $0.0998 by the end of 2020 and has been under consolidation for the entirety of 2021. ZIL is currently trading at $0.089 after a significant breakout from a crucial pattern.
Zilliqa price aims for $0.10 with no opposition ahead
On the daily chart, the breakout above the descending triangle pattern formed has a price target of $0.10 which is calculated by subtracting the difference between the top and the bottom, $0.03, in this case, and adding it to the breakout price of $0.07, which gives us a $0.10 target.
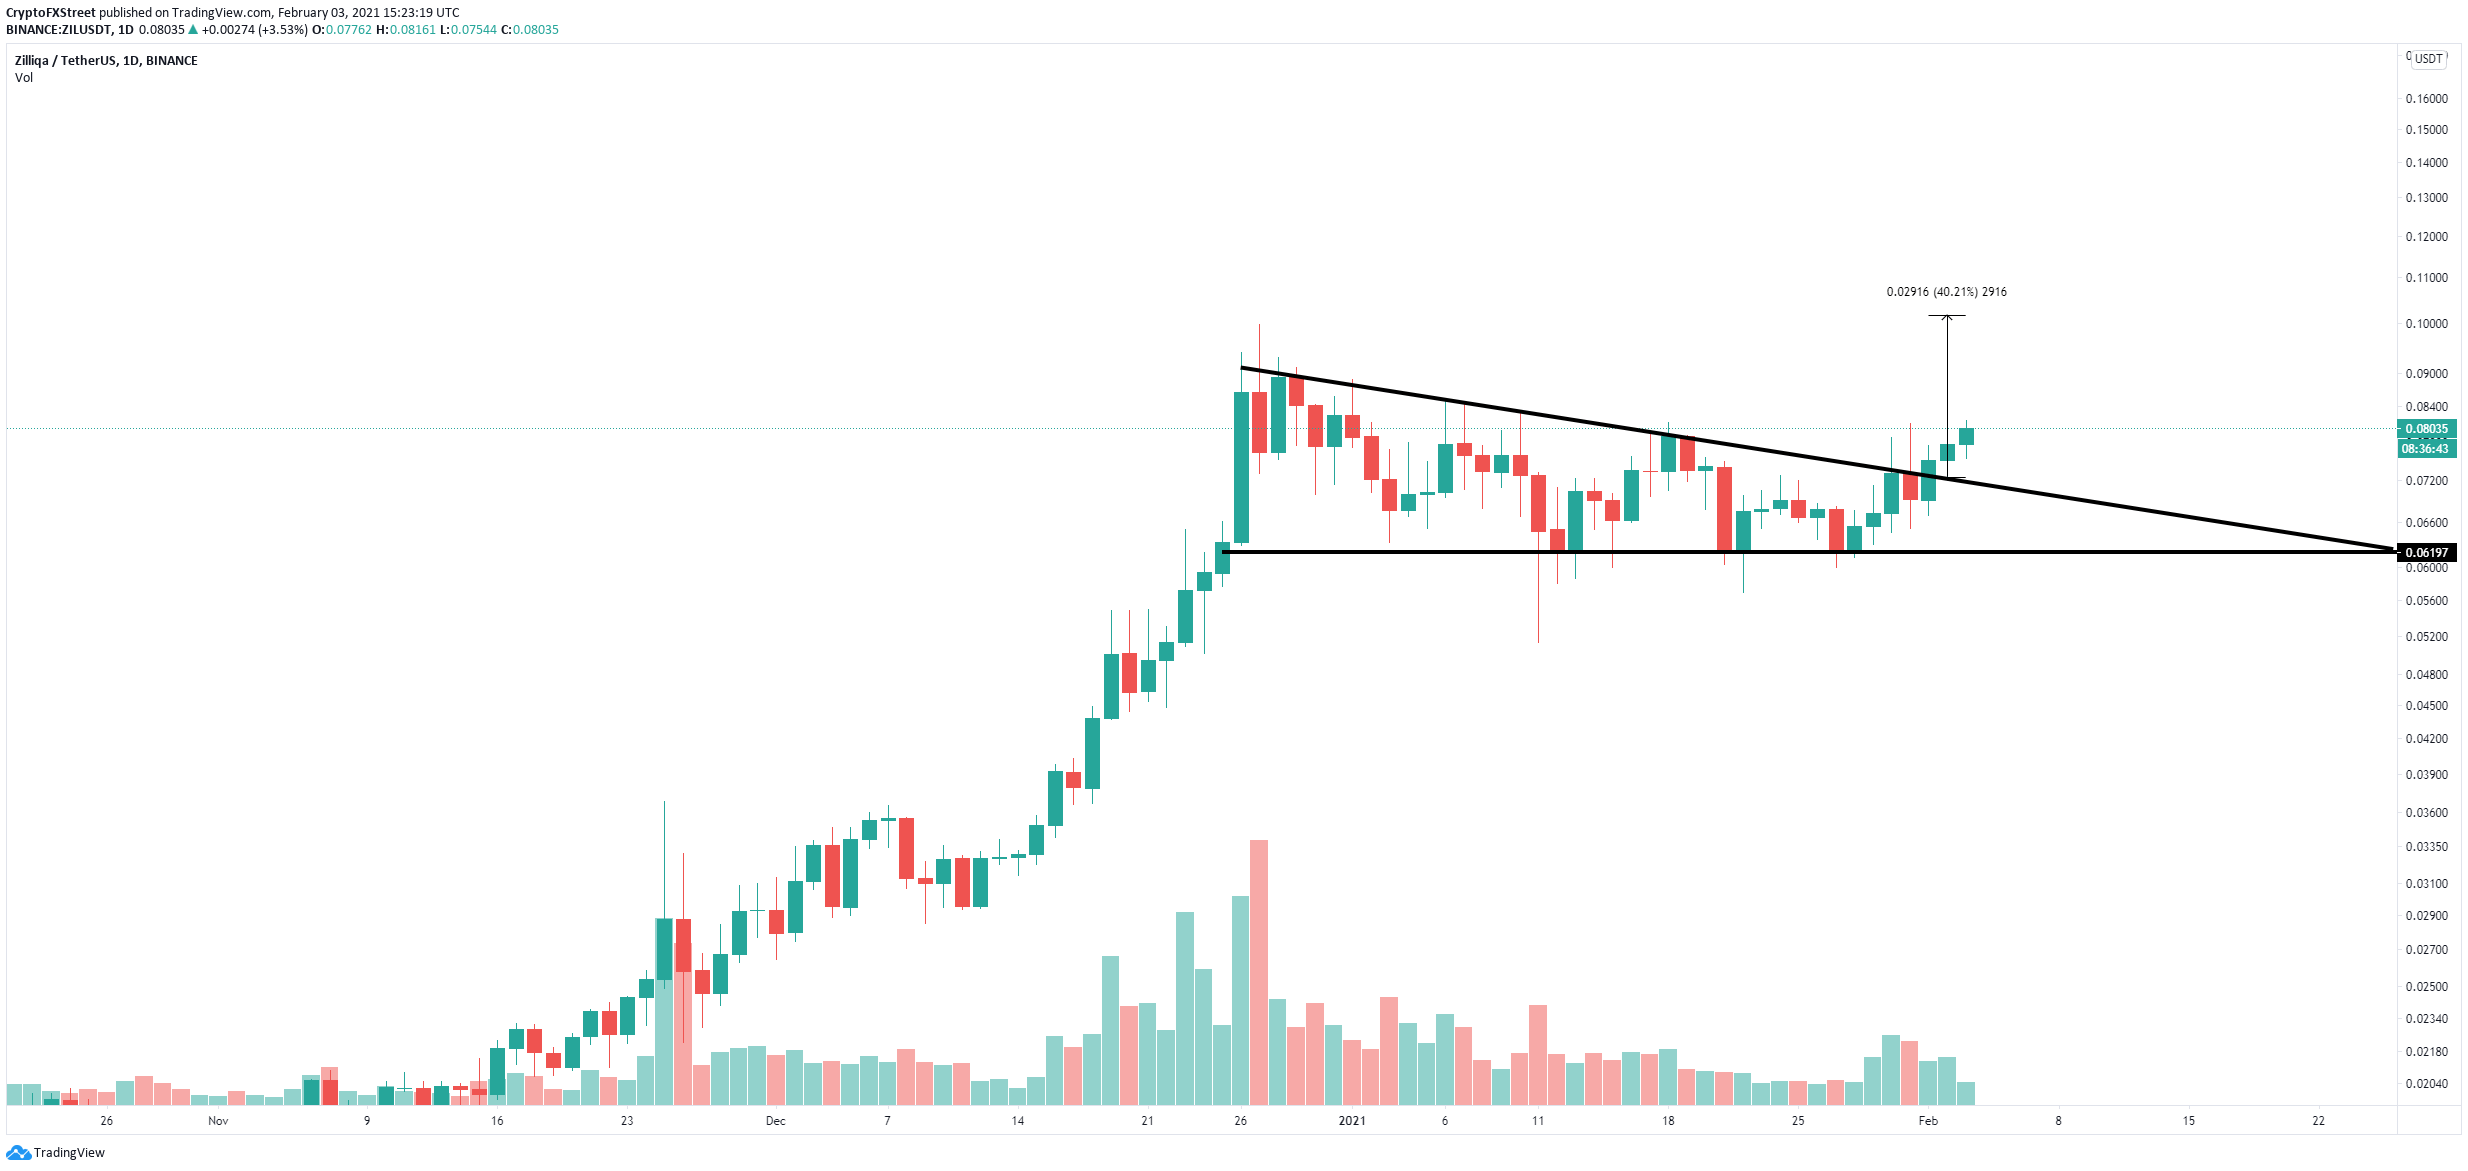
ZIL/USD daily chart
On the 1-hour chart, a symmetrical triangle has formed with the resistance trendline right around $0.08, the current price. A breakout above this point will lead Zilliqa price towards $0.09 in the short-term.
%20%5B16.28.09,%2003%20Feb,%202021%5D-637479630394253736.png)
ZIL Social Volume
In the past week, we have seen two major spikes in social volume on January 30 and 31, and both predicted upcoming corrections. Although Zilliqa price is higher now, the social volume is far lower which indicates the digital asset can climb higher.
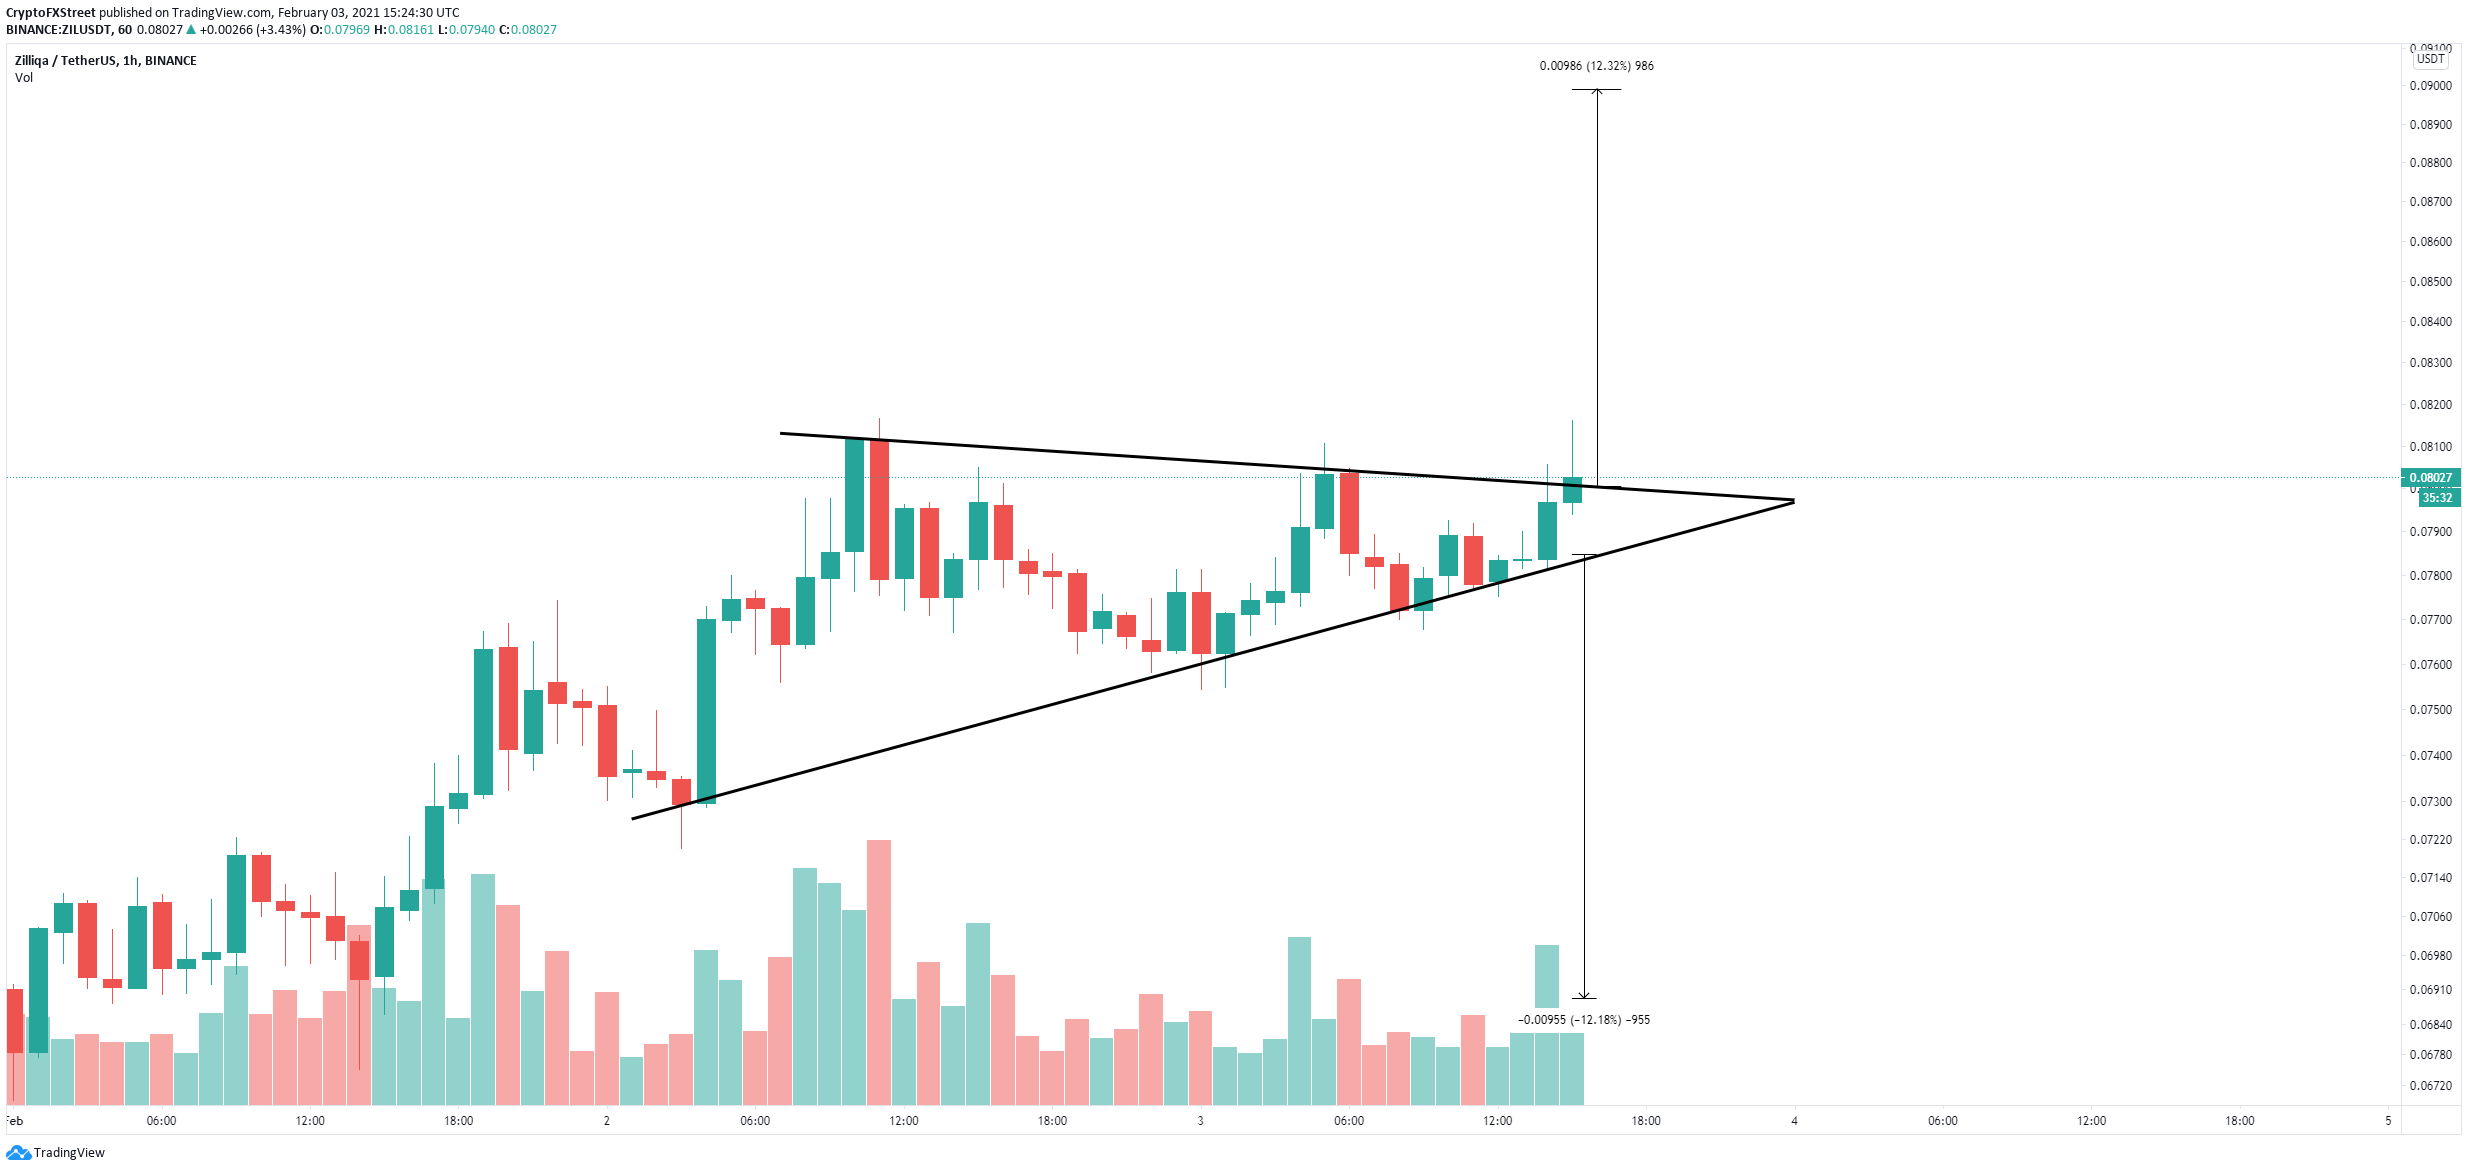
ZIL/USD 1-hour chart
However, it seems that ZIL price is getting rejected from the top trendline resistance and could quickly fall towards the lower trendline at $0.78. A breakdown below this level will drive Zilliqa price down to $0.068.
