- Zilliqa price is trading between a symmetrical triangle pattern on the 12-hour chart.
- The digital asset is barely holding a crucial support level at $0.066 which could lead to a massive fall.
Zilliqa had a massive run to $0.099 that ended on December 27, 2020. The digital asset has been under consolidation since then and it’s now on the verge of plummeting if a crucial support level is not defended by the bulls.
Zilliqa price could dive towards $0.032 if bulls can’t defend this level
On the 12-hour chart, Zilliqa has formed a symmetrical triangle pattern which seems to be on the verge of bursting in favor of the bears. A breakdown below the critical support level at $0.066 would lead Zilliqa price towards a low of $0.032, a 50% move.
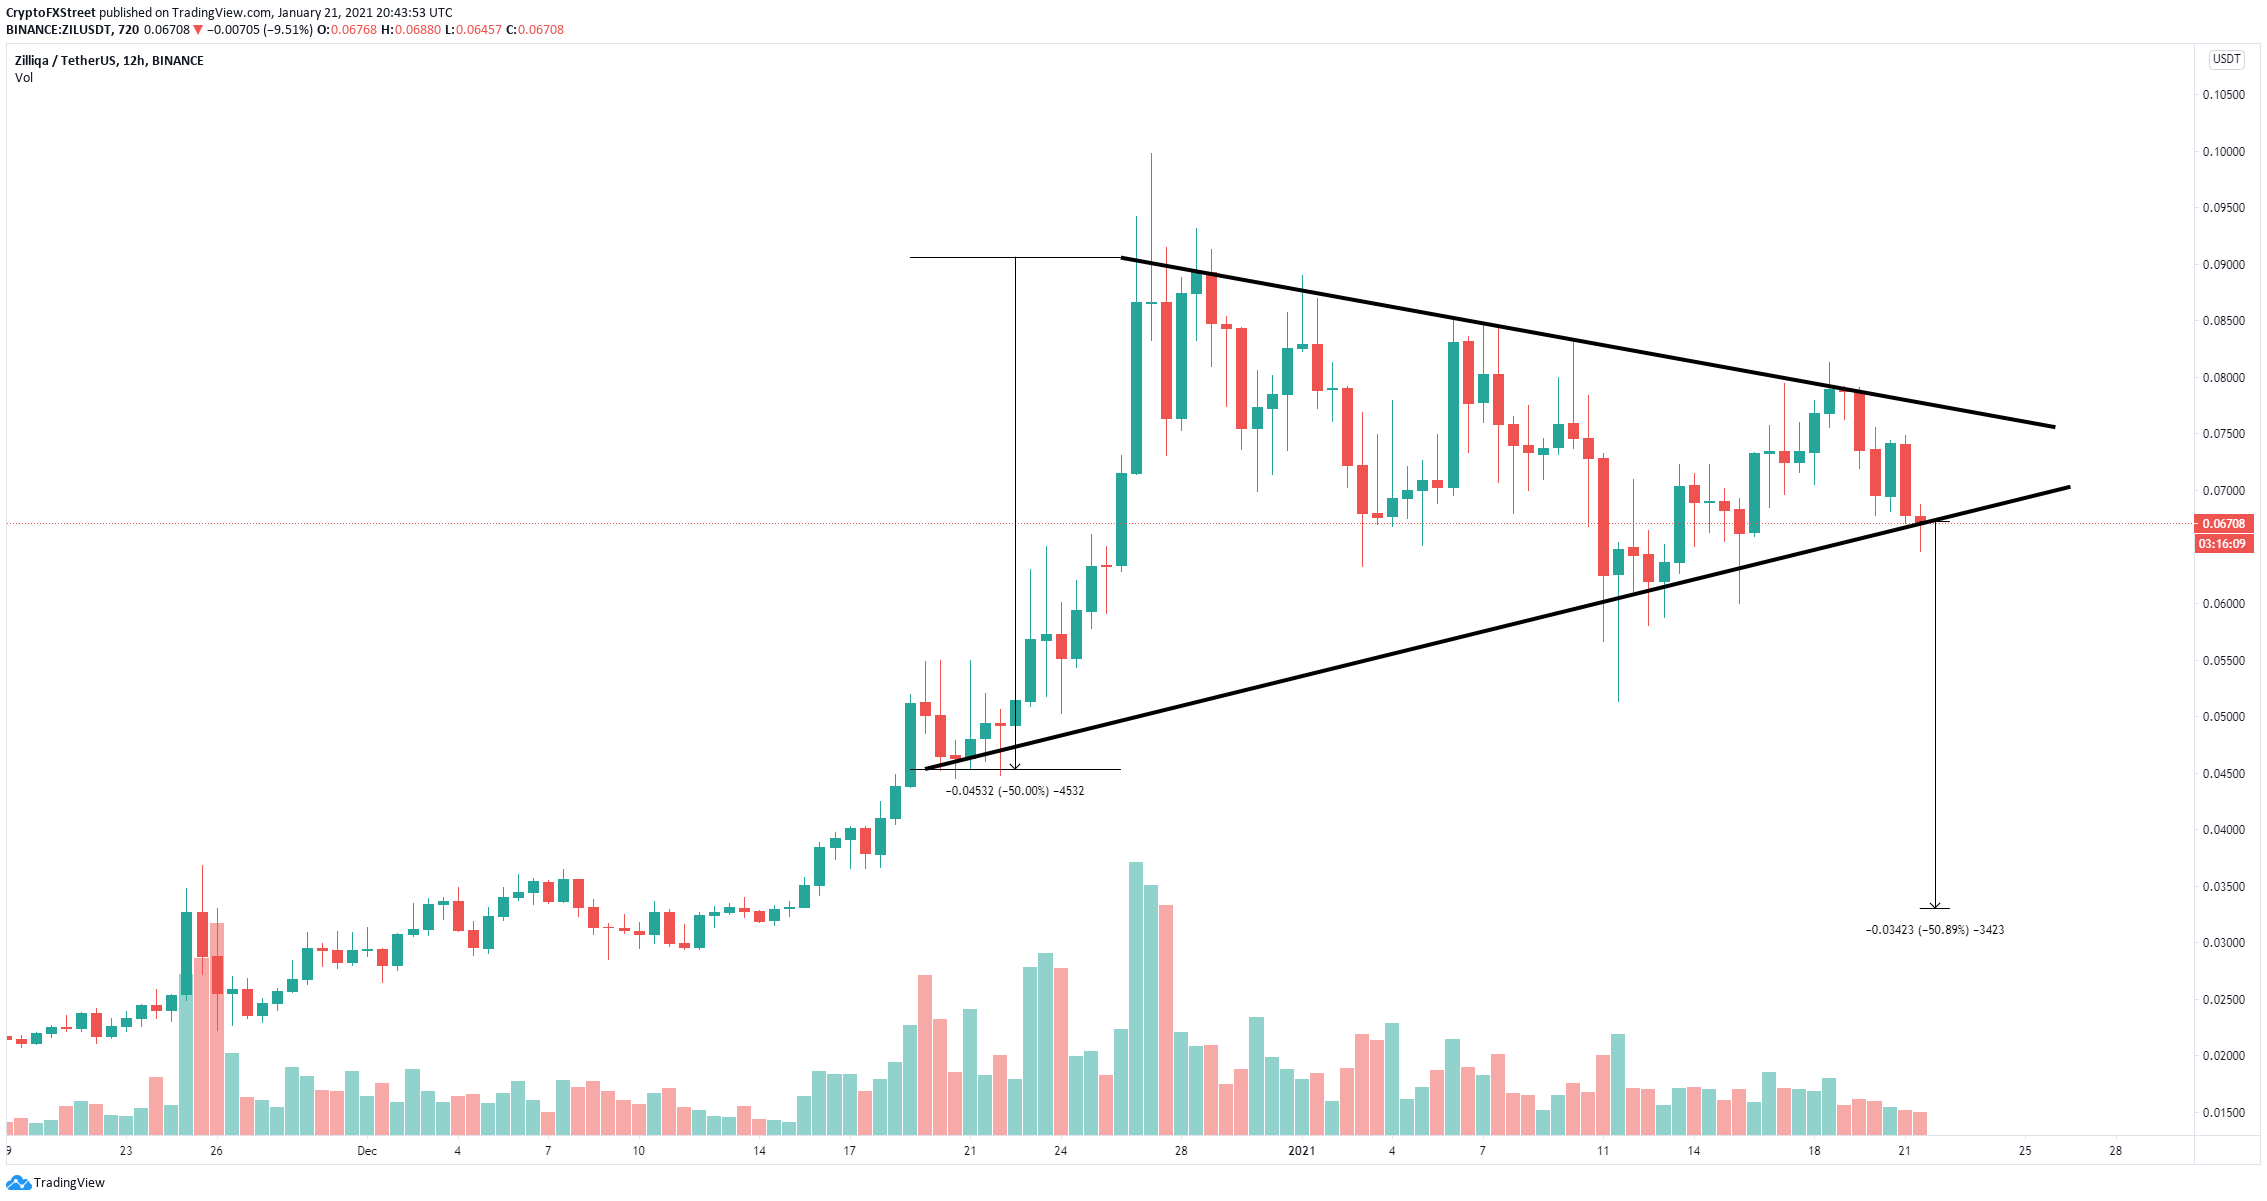
ZIL/USD 12-hour chart
There is some hope for Zilliqa as the TD Sequential indicator is prepared to present a buy signal on the 2-hour chart which should help the bulls defend the crucial support level of $0.066, at least in the short-term.
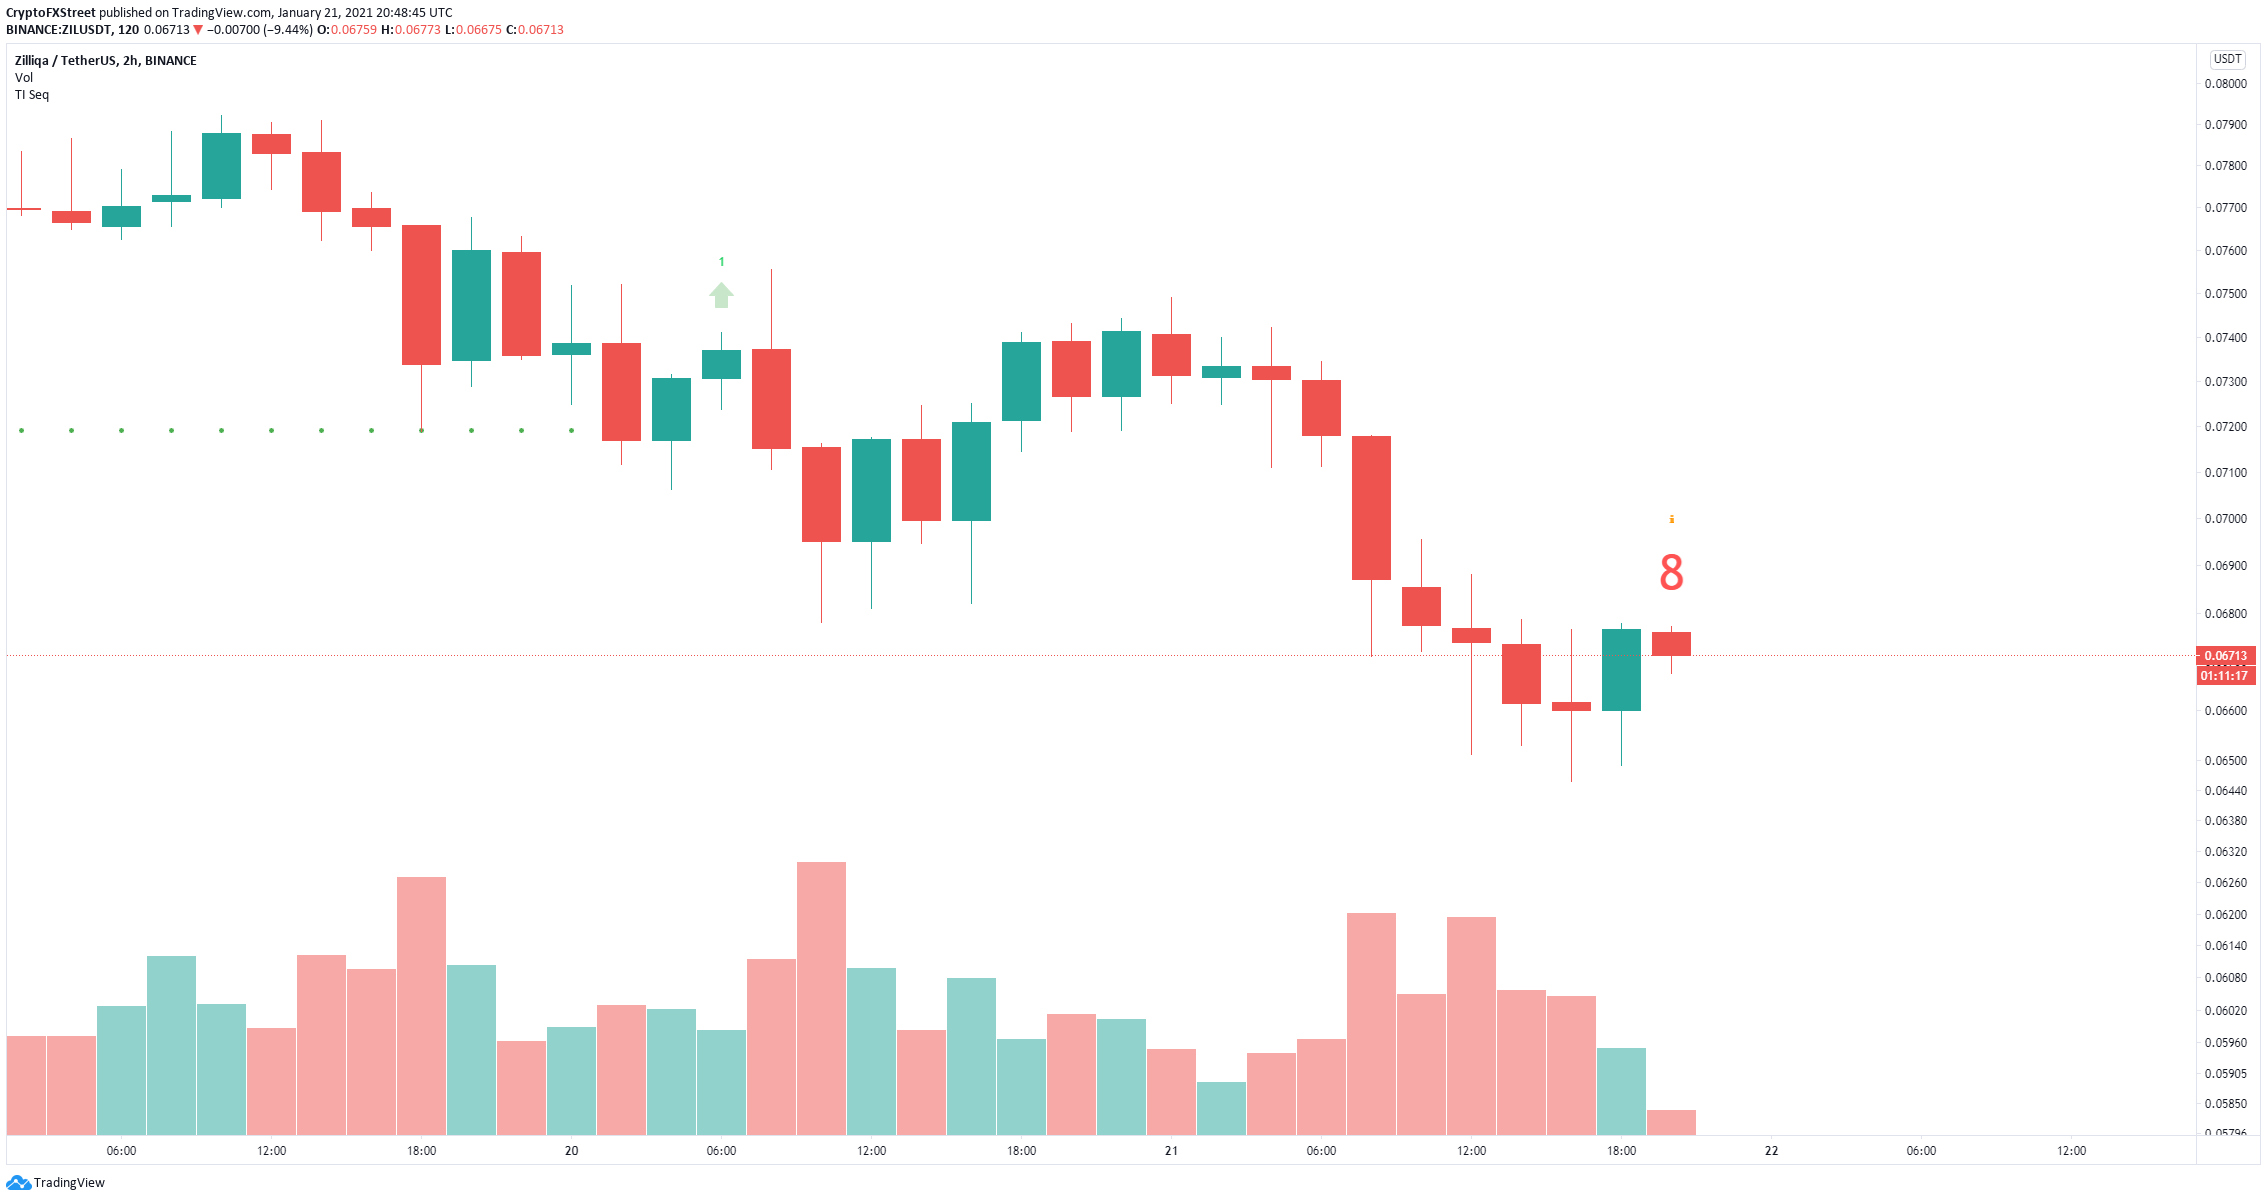
ZIL/USD 2-hour chart
Successfully defending it could drive Zilliqa price towards the upper trendline of the pattern at $0.076. A breakout of this point would yield similar results pushing the digital asset by up to 50% in the long-term.
