The Aussie crashed against the US dollar. It lost the long term range, the parity line and then the uptrend support line that accompanied it since mid 2011.
Where is it headed now? Some think it could fall as low as 0.60. Here’s a view at the levels lost and the big levels ahead.
The Fall
AUD/USD traded between 1.0150 to 1.06 for nearly a year. The 1.06 line was well established, and it was challenged at least 5 times during this period. The bottom end was more flexible, but it was generally around 1.0150. An earlier attempt to break below 1.0150 saw the pair bounce from 1.0110 in a hammer pattern.
However, the recent break was already huge: the Aussie lost the 1.0150 and never looked back. It fell below parity in the same week, but managed to hold on.
The following week already saw a deeper fall: AUD/USD already left the parity line behind and fell towards 0.97, eventually closing at 0.9725.
In the bigger picture, the pair clearly broke below the uptrend support line (black line on the chart) that was first created in October 2011 when the pair hit 0.9383. It was then formed in June 2012, when the pair flirted with 0.96.
Here is the chart, and explanations about the big lines follow:
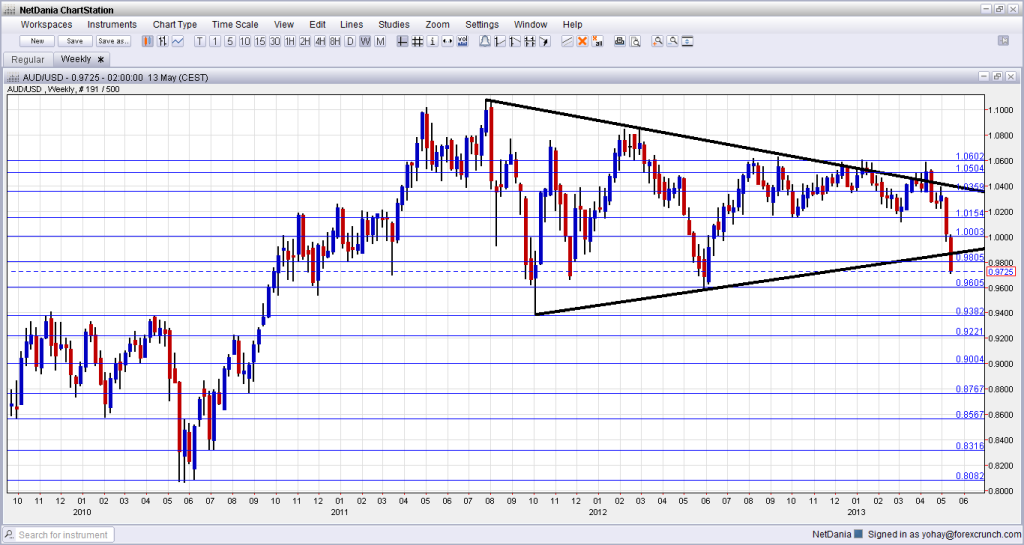
The Big Levels
AUD/USD remains resistance, but it is getting far. The 0.98 line provided support in early 2011 and now serves as minor resistance.
The next significant round number is 0.96: the pair met this level in 2011, and made another attempt to get closer. In June 2012, it battled the line and eventually rose. Also 0.9660 is notable after working as support towards the end of 2011.
The aforementioned low of October 2011 at 0.9383 is the next important line. Not only was it support at that time, but it was also stubborn resistance in early 2010 and late 2009, similar to the role that 1.06 played in the past year.
Below this line, we can find 0.9220, which worked as high support during 2009. It is followed by the round number of 0.90, which is considered by FX Concept’s John Taylor as a “conservative target” for the pair.
Below 0.90, 0.8767 worked as support in 2009. 0.8578 was the bottom border of a long term range and a very distinct line. 0.8315 worked as a stepping stone during 2010. The last line in the bottom is the 2010 low of 0.8066.
What do you think? Will the Aussie continue falling? Or is it ready for a big upwards correction?
Further reading:
- AUD/USD weekly forecast. – All events, short term lines and analysis.
- Aussie presents a total collapse: a look at 5 Aussie pairs – The Aussie also collapsed against other currencies, and lost some big levels.
- Forex Analysis: AUD/USD Continues Dramatic Plunge to Establish New Lows – Technical analysis by James Chen.
- AUDUSD Bearish; Wait On Pull-back For New Shorts – Elliott Wave Analysis
