Best Forex Indicators
Thinking of trading the trillion-dollar foreign exchange market? Then you need to know about the best forex indicators to use.
As the interest in online trading opportunities has boomed, there are now many more individuals creating their own forex technical indicators. However, only a few have stood the test of time and will prove to be the most important in your trading arsenal.
In this ‘Best Forex Indicators’ guide, we go through the best indicators for forex – how to use them, when to use them, and more!
Best Forex Options Indicators List
Below is a list of the top 10 best forex indicators to navigate the worldwide currency market. Whether you are looking for forex scalping indicators, forex trend indicators or forex volume indicators the list below outlines the best ones to use.
- Moving Averages
- Bollinger Bands
- Awesome Oscillator
- Relative Strength Index
- Stochastic Oscillator
- Williams %R
- Average True Range
- Parabolic SAR
- Momentum Indicator
- MACD
You can use all these indicators on eToro, our recommended forex broker.
67% of retail investors lose money trading CFDs at this site
A Closer Look at the Best 10 Forex Trading Indicators
In this section, we go through the top 10 best indicators for forex in more detail so you can see them in action and incorporate them in your trading. To do this we will be using the technical analysis charts and indicators provided by top-rated broker eToro. You can also use these forex indicators for Metatrader 4.
1. Moving Averages
Moving averages is one of the best forex trend indicators there are. They help to smooth price data so you can identify the overall market trends. The levels of moving averages are commonly quoted in financial media and used by trend-following algorithms.
The two most popular types of moving averages are the Simple Moving Average (SMA) and the Exponential Moving Average (EMA). There are other varieties such as the Weighted Moving Average (WMA) as well.
The Simple Moving Average (SMA) is formed on a chart by calculating the average price of a specified number of bars or periods. The average price is usually taken from the closing price but can be adjusted to calculate from the open, high, or low.
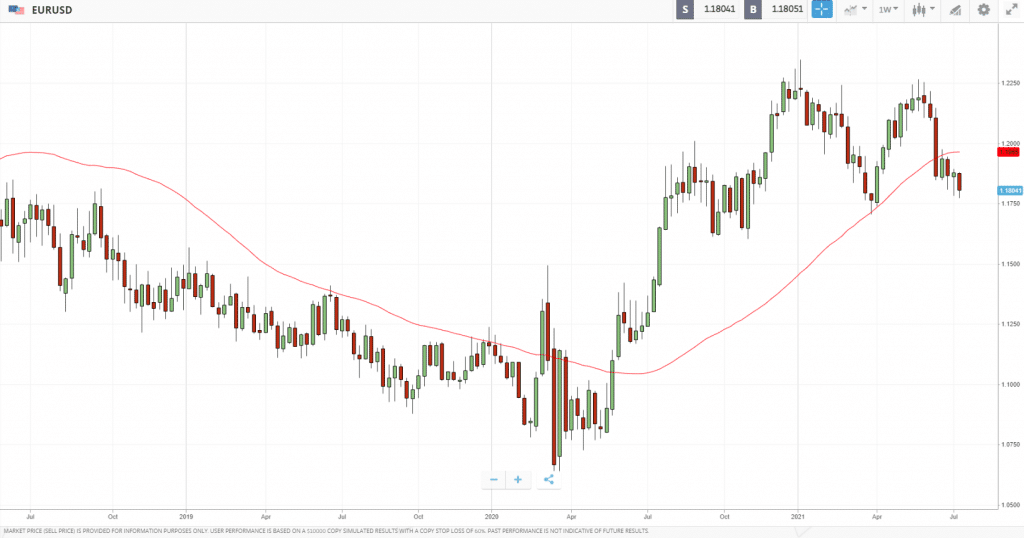
The red line shown in the chart above represents the 50-period simple moving average – the average price over the last 50 bars.
If the price is above the moving average it typically indicates an uptrend. This would result in trend-following traders looking for long trades. If the price is below the moving average it typically indicates a downtrend where trend following traders may look for short trades.
2. Bollinger Bands
Bollinger Bands were developed by chart technician John Bollinger and are used as a forex volatility indicator. They have three lines with the middle line representing a simple moving average which is typically the 20 SMA.
The bands above and below the moving average are based on a mathematical formula for standard deviation. These bands increase and decrease as volatility changes. Traders would analyse these bands to identify low volatility and high volatility market conditions.
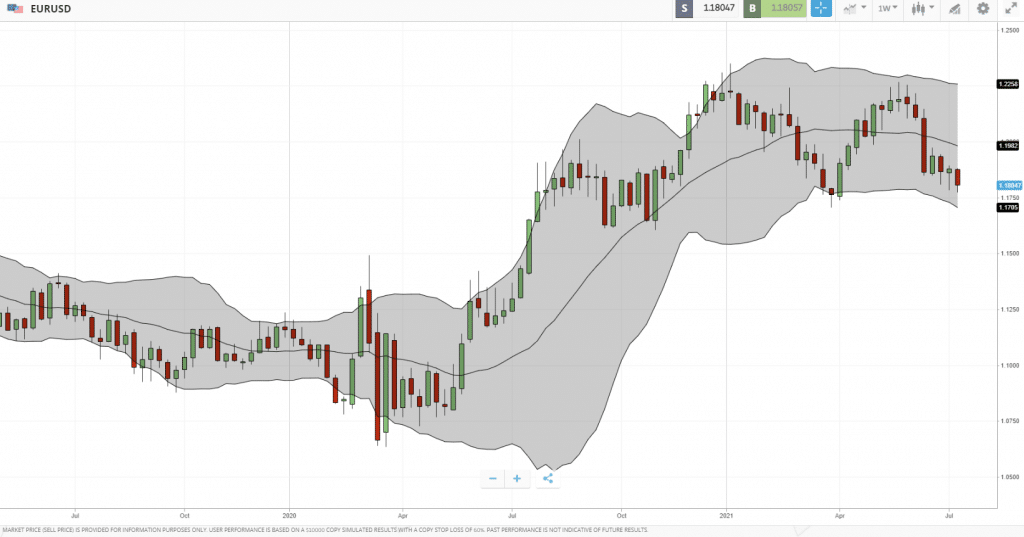
When the Bollinger Bands are flat, close together, and contracting it indicates the volatility of the market is low and potentially more range based. When the Bollinger Bands expand and move away from each other it indicates the volatility of the market is increasing and is more likely in a trend.
Traders will often use the upper and lower bands as areas of support and resistance where market turns could take place. Forex breakout traders will also use them and wait for the price to close outside of the bands to indicate a volatility-based trend.
3. Awesome Oscillator
The Awesome Oscillator is a momentum-based indicator that is used to confirm the trendlines of the market and any potential changes in the trend. The indicator compares current price data to historic price data to forecast the momentum of the market.
The underlying calculation for the Awesome Oscillator is relatively simple. It is the computation from subtracting the 34 SMA (simple moving average) of median price from the 5 SMA of the median price. It can be used on any timeframe and is automatically calculated in your trading system.
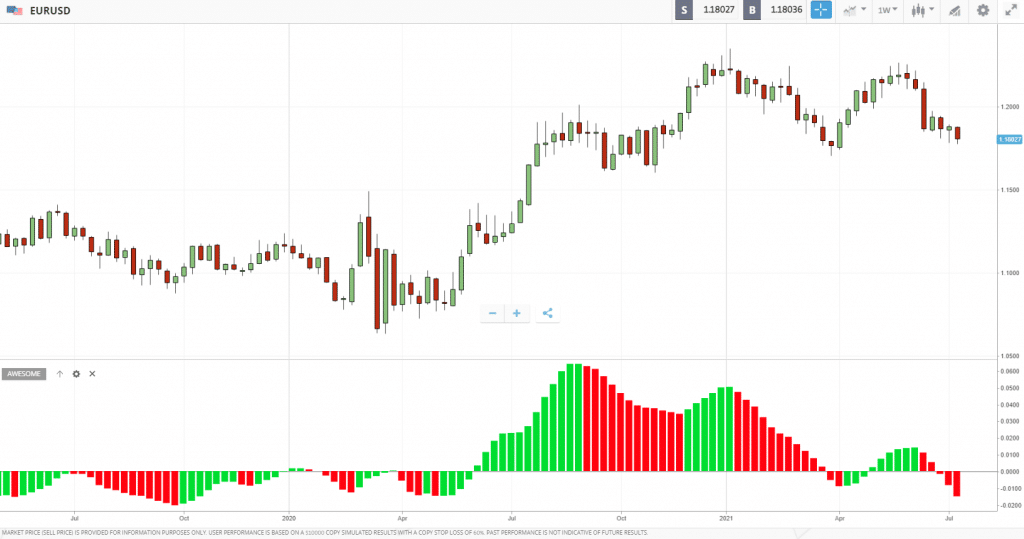
One of the most common ways to use the Awesome Oscillator is to wait for the indicator to crossover the zero line. When the indicator crosses above from negative values to positive values it indicates bullish momentum. When the indicator crosses below from positive values to negative values it indicates bearish momentum.
4. Relative Strength Index
The Relative Strength Index, otherwise known as the RSI, is a momentum oscillator developed by J. Welles Wilder. The aim of the indicator is to measure the speed and change of price movements to find which direction has more strength.
The RSI oscillates between zero and 100. It is generally considered overbought when the indicator moves above 70 and oversold when below 30. The RSI is one of the oldest and time-tested forex indicators available. But while traditionally used for overbought and oversold signals it is now more commonly used for divergences.
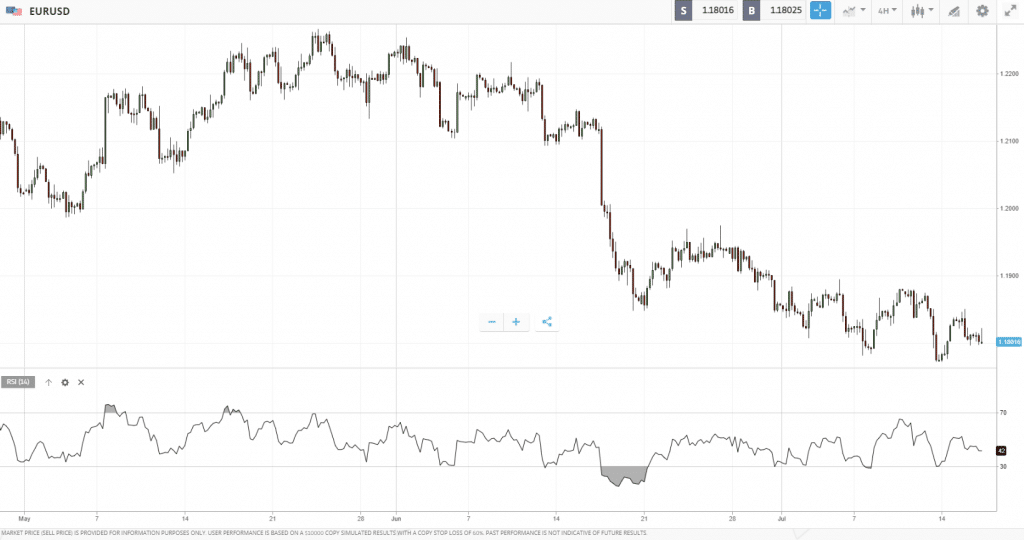
RSI divergence occurs when the price moves in the opposite direction of the indicator. This highlights the recent trend is losing momentum and a reversal could be imminent. It’s an indicator that can be used on any timeframe.
5. Stochastic Oscillator
The Stochastic Oscillator was developed in 1950 by George Lane. It is another momentum indicator that shows where the price is relative to the high and low range of a set number of bars or periods. The underlying concept of the indicator is that momentum changes first, before price turns.
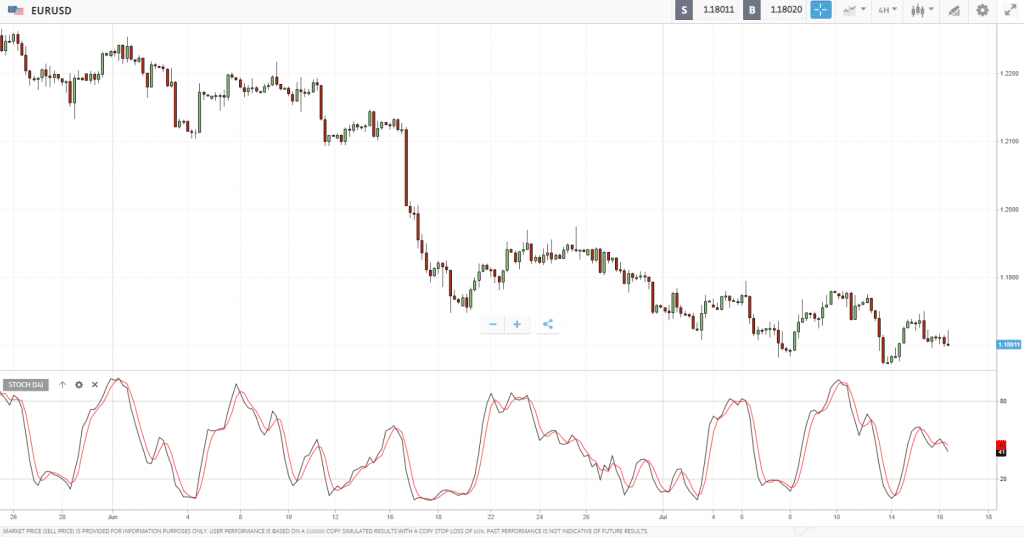
While the indicator is used for overbought and oversold signals, it is more commonly used for divergences. This is where the Stochastic Oscillator moves in the opposite direction to the price of the market. This situation highlights that momentum is weakening and thereby causing a potential turn in price.
6. Williams %R
The Williams %R indicator was developed by famed trader Larry Williams. The indicator represents the level of the closing price relative to the highest high for a user-specified number of bars or periods.
The indicator oscillates between zero and 100. When the indicator line is in between 0 and -20 it indicates an overbought market. When the indicator line is in between -80 to -100 it indicates an oversold market.
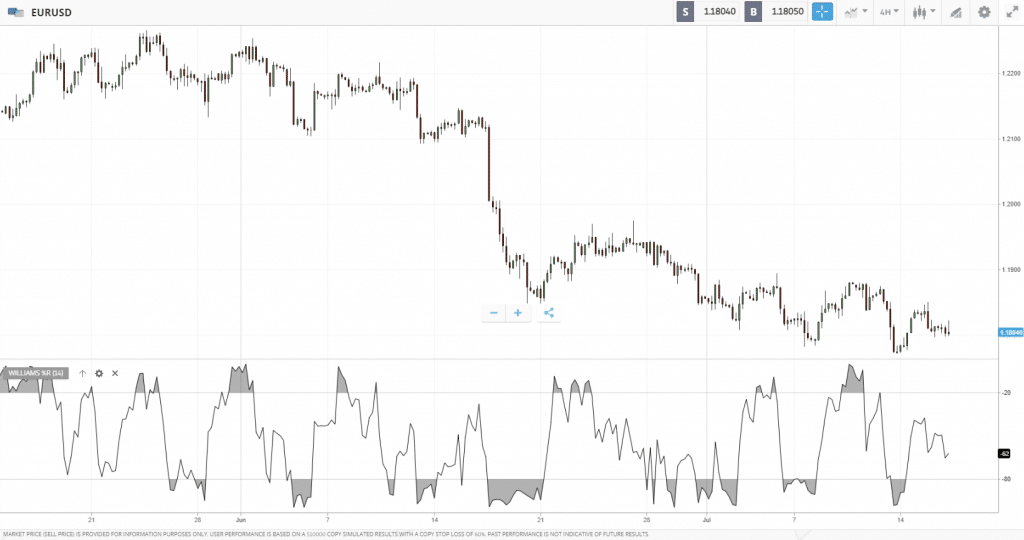
The mid-point level at -50 is also considered important. As the price moves above the -50 line it indicators bullish momentum is building. As the price moves below the -50 line it indicates bearish momentum is building.
The Williams %R indicator can be used as an overbought and oversold indicator as well as a divergence indicator as well.
If the indicator line does not follow the market price higher it is considered a bullish momentum failure where a reversal lower could be likely. If the indicator line does not follow the market price lower it is considered a bearish momentum failure where a reversal higher could be more likely.
7. Average True Range
The Average True Range (ATR) indicator was developed by J. Welles Wilder and is used as a measure of volatility. The calculation of the indicator starts with analysing the True Range of the market which is either the current high less the current low, or the current high less the previous close, or the current low less the previous close.
The most common measurement when using the ATR is to use 14 periods. This can be applied to any of the timeframes such as the daily chart or 1-hour chart. As the indicator represents the average range over the last 14 bars or periods it can be used to aid in trade management techniques.
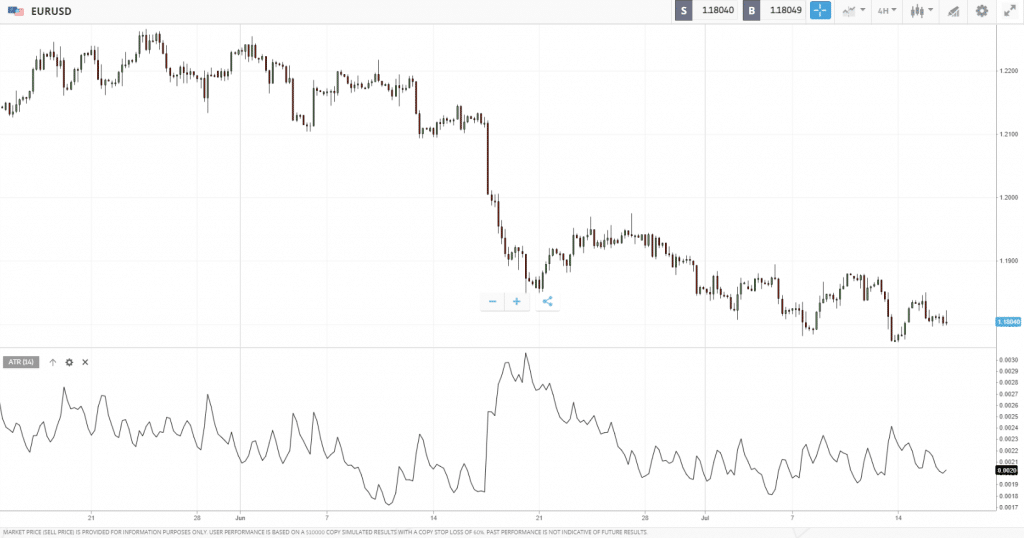
For example, a forex swing trader will need to know the Average True Range to help with stop loss placement. If the average range of the market is 100 pips and your stop loss is set at only 30 pips, it’s likely you could be stopped out too early on.
8. Parabolic SAR
The Parabolic SAR indicator is another indicator developed by J. Welles Wilder. The indicator is much more unique than his others as the Parabolic SAR is a price and time-based indicator.
The SAR acronym stands for ‘stop and reverse.’ Essentially, the indicator will trail price as the trend moves over time. It does this by drawing a small dot above price in a downtrend and below the price in an uptrend. It looks similar to a trailing stop.
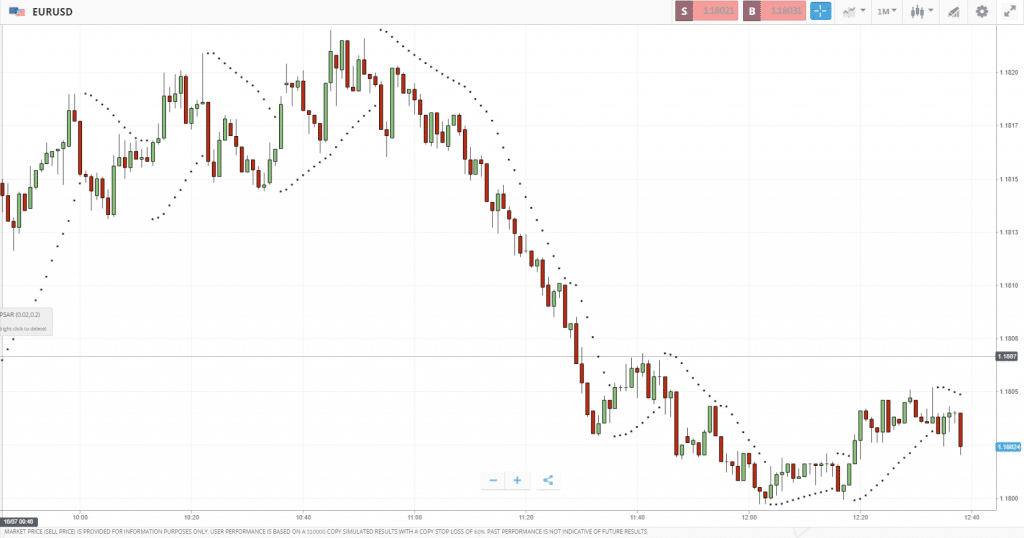
There are a variety of ways to use the Parabolic SAR indicator. Traders could use it as a trend confirmation and only trade in the direction of the indicator. Another method is to actually use it for trade management and trail a stop loss to stick with the trend for higher reward to risk trades.
9. Momentum Indicator
The Momentum Indicator is used to identify when prices are moving up or down and how strongly. It does this by comparing the current closing price to the closing price of a specified number of periods historically.
When the indicator line is in positive territory (above zero) it indicates that momentum is increasing. When the indicator line is in negative territory (below zero) it indicates that momentum is weakening.
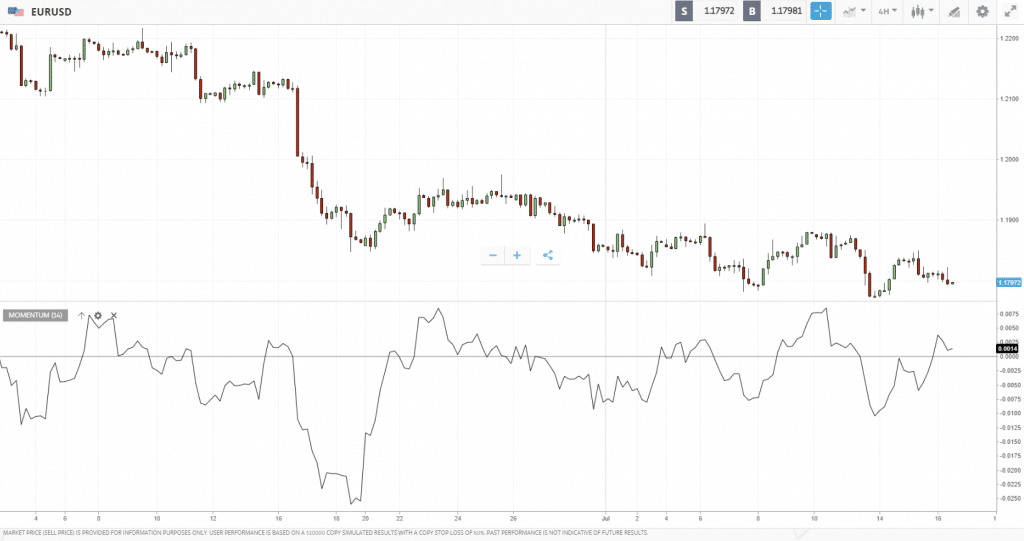
Traders could use the momentum indicator to help confirm the trend, as well as to look for divergences. As momentum is often a leading indicator of price turns using momentum divergence can be powerful in the foreign exchange market.
10. MACD
The MACD is one of the most popular forex indicators around. It was first developed by Gerald Appel and is one of the best forex indicators for momentum. MACD stands for Moving Average Convergence Divergence and can be used in a variety of ways.
The MACD indicator is created by calculating the difference between two moving averages and then creating an average of this difference plotted as a histogram. Traders can use the MACD to help with trend-following strategies and momentum strategies.
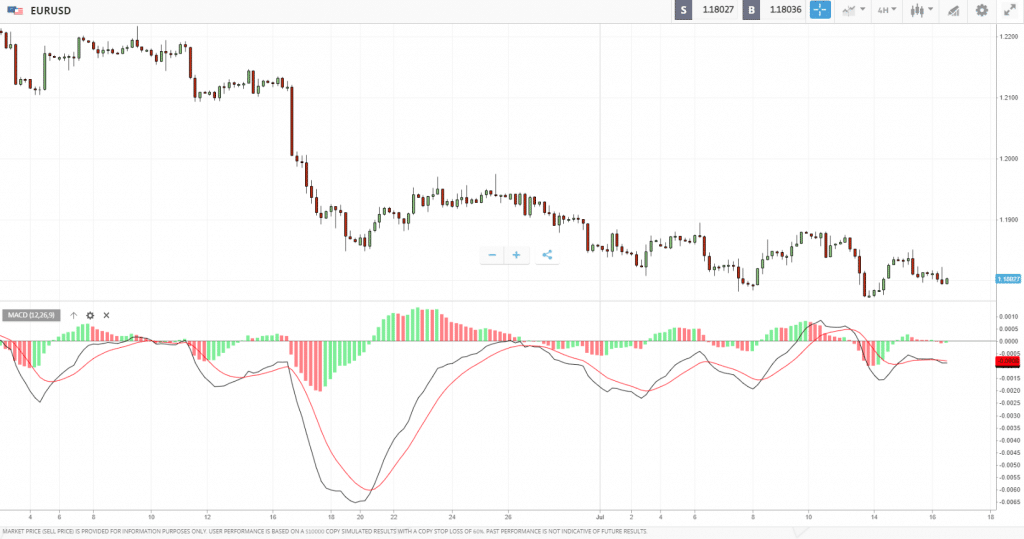
The typical settings for the forex MACD are 12, 26, 9. The two exponential moving averages used are the 12-period and 26-period. The histogram is a 9-period exponential moving average of the MACD line.
Traders will often wait for a cross of the MACD lines to confirm the trend while using divergences in the MACD line and histogram for changes in momentum. It’s not as effective for overbought and oversold as it is not bounded like other oscillators which move between zero and 100.
What are Forex Indicators?
Forex indicators are essential tools for traders. They help to analyse price movements and forecast where the price of a market could move next. While they don’t predict what will happen next they can give traders a much clearer understanding of the current market situation and any shifts within it.
The most popular indicators were developed between 1950 and 1980 which is a boom period in everyday individuals being able to access the financial markets. While there are now thousands of technical indicators available only a few a worthwhile focusing on – as highlighted in the top 10 best forex indicators section above.
While forex indicators form part of technical analysis they work even better when used with other forms of analysis. The combination of non-correlated analysis tools is generally considered to be one of the best approaches to trading the foreign exchange market.
Indicators are also an important part of many stock trading strategies, with stock indicators being offered by companies like AltIndex.
Types of Forex Indicators
Forex indicators for MT4 and other trading platforms fall into four main categories and can be used to help analyse what the market is doing, where the market could move to next as well as provide entry and exit levels.
Let’s have a look at the four main categories of forex indicators.
1. Forex Trend Indicators
Forex trend indicators enable traders to analyse the trend of the market. While technical analysts will focus on analysing cycles to determine the trend, some of the best forex indicators for trending markets can give you the information you need much more quickly.
Forex indicators that help analyse the trend include moving averages. This forex trend indicator shows the average price of the market and provides a quick representation of its historical price movement. It can also help to identify when the market is not trending but instead in a range (when the moving average line goes flat).
Determining the overall trend of the market is one of the most important first steps in knowing when and where to trade. This is because once a trend is set in motion it can continue for some time before it turns.
2. Forex Momentum Indicators
Forex momentum indicators help traders to identify the strength of a trend. If the momentum in an uptrend starts to fade it could be a sign the market is about to turn. There are different types of momentum indicators – leading and lagging.
Leading forex momentum indicators include the Stochastic Oscillator and MACD. These indicators show situations when the market price is moving in one direction but the indicator in another. This is known as divergence and is commonly used to trade turning points in the market.
3. Forex Volatility Indicators
The volatility of the market constantly changes. A strategy may work in a high volatility market but may not work in a low volatility market. Using indicators to help identify the volatility of a market is essential in choosing the right approach when trading.
Some of the most popular forex volatility indicators include the Average True Range and Bollinger Bands.
4. Forex Volume Indicators
The volume of the market shows you how many participants were involved in that trading day. However, while volume indicators work well on exchange-traded markets like stocks they may not be as effective in the ‘over the counter forex market.
The currency market has no central exchange. Your broker will gather their price data from a liquidity provider which could be a few or many of the biggest investment banks in the world. This means that low-quality forex brokers may not give you the right price if they have only one liquidity provider.
Where to Use the Best Forex Indicators
Trading with the right forex broker is essential in getting good price data where your forex indicators are more likely to work and give you the right signals. Below are two of the best forex CFD brokers to trade indicators with.
1. eToro – Best Forex Broker for Copy Trading Forex Indicators
eToro is by far one of the best and biggest forex brokers around. You can trade all the major, minor and exotic currencies 100% commission-free with low spreads. Furthermore, you can tap into the easy-to-access eToro charts for forex from its proprietary feature-rich trading platform.
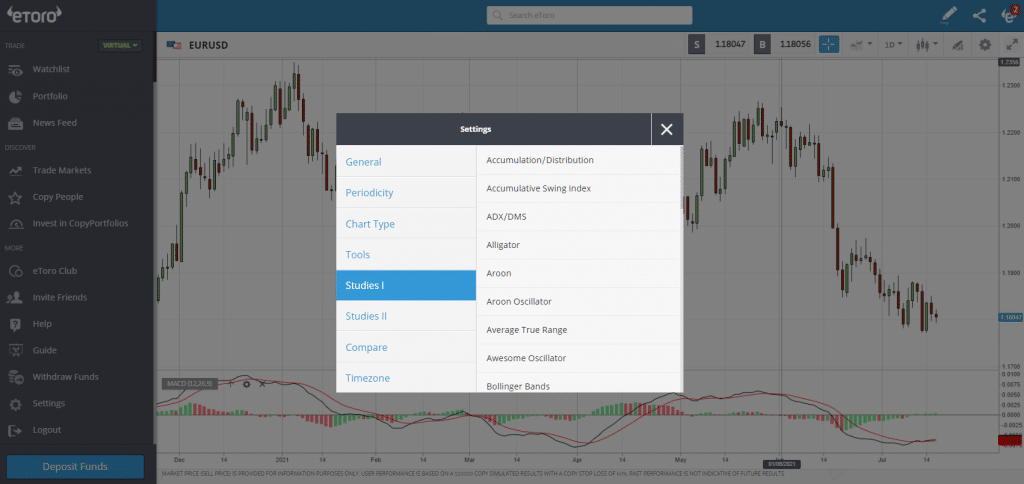
One of eToro’s best forex indicators is its social trading and copy trading platform. You can see the performance of other forex traders and have their trades copied onto your own account. A different type of indicator to grow your capital!
- Regulated by FCA, CySEC and ASIC
- Trade currencies 24/5 and cryptocurrencies 24/7
- Access 2,400+ global markets
- World’s largest copy trading platform
- Free forex indicators included
- 100% commission-free!
![]() Cons
Cons
- $5 withdrawal fee
67% of retail investors lose money trading CFDs at this site
2. Capital.com – Best Broker for Forex Indicators for MT4
Capital.com is another top forex broker as you can trade 100% commission-free on more than 3,000+ global markets including an impressive range for correlated and no correlated forex pairs (such as EUR/USD) and cryptos. Furthermore, deposits and withdrawals are also 100% commission-free and the spreads are low too.
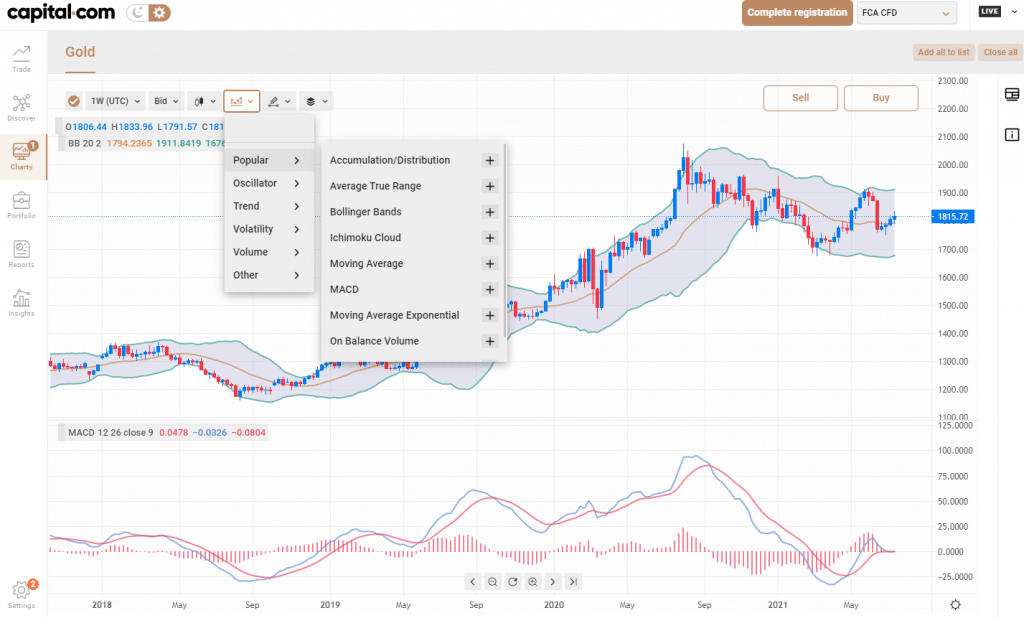
The charting functionality from Capital.com is great and is very clear and simple to use. You can trade through TradingView style charts or access top forex indicators for MT4. In fact, you can access a wide range of indicators for desktop and web and its own forex app.
- FCA and CySEC regulated
- 100% commission-free trading
- Fee-free deposits and withdrawals
- Low and competitive spreads
- Access more than 3,000+ global markets
- Multiple trading platforms provided
- Low minimum deposit ($20)
![]() Cons
Cons
- Not available to US residents
72.6% of retail investors lose money trading CFDs at this site.
How to Use Forex Indicators on eToro
If you’re interested in getting started then follow this step-by-step process on how to do so with forex broker eToro.
Step 1: Open an Account
To start trading using the eToro forex indicators you need to open an account. It only takes a few minutes and starts with clicking the Join Now button on the broker’s website. Once you fill in some personal details such as a username, email and password you will be taken to the eToro web platform.
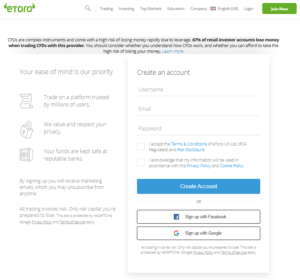
67% of retail investors lose money trading CFDs at this site
As a regulated broker, eToro will need you to fill out a questionnaire so they know more about you and to follow regulatory requirements.
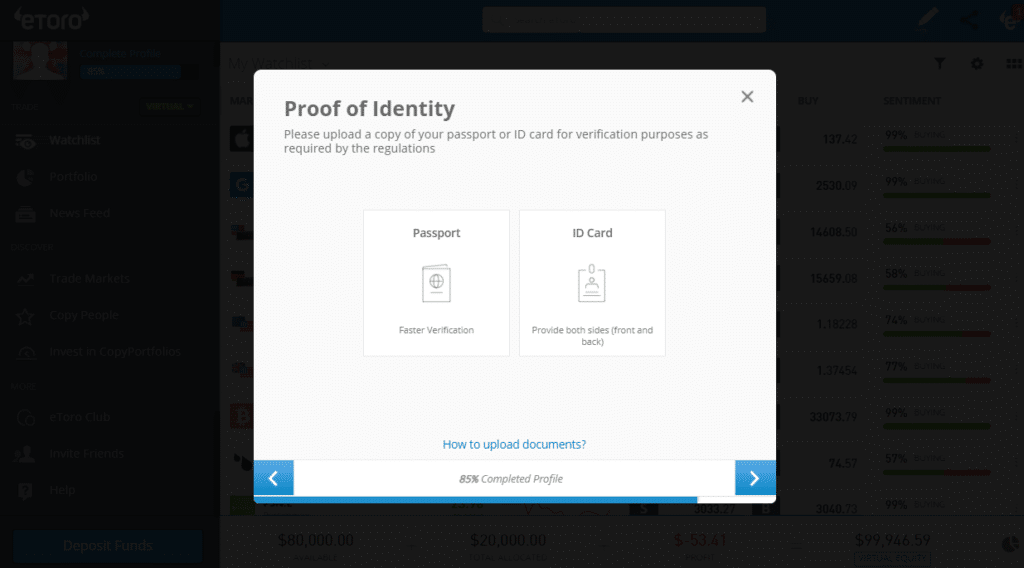
Step 2: Upload your ID
To comply with AML and KYC regulations you will need to verify your identity and address. These documents can be uploaded directly from the trading platform and could be:
- A valid passport or driver’s licence for ID verification
- A bank account statement or utility bill, issued in the last six months, for address verification

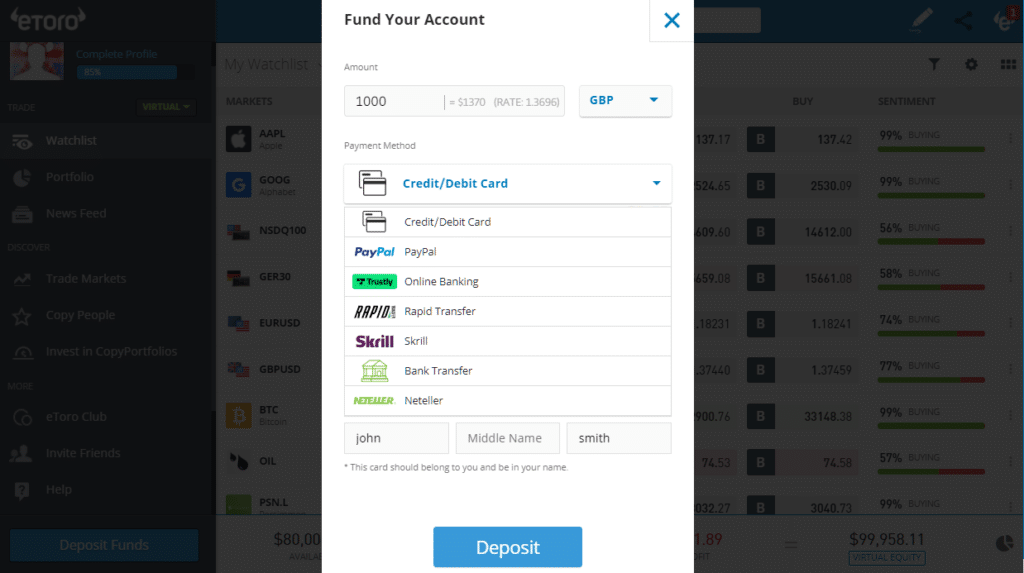
Step 3: Fund your account
You can fund your eToro account using the following fee-free methods:
- Bank wire transfer
- Debit/credit card
- Neteller
- Skrill
- PayPal
Step 4: Choose your market and forex indicator!
You can trade on more than 2,400+ financial instruments offered by eToro which includes a large selection of currency pairs. After searching for your market in the top search box, click the chart icon and expand it into full size.
67% of retail investors lose money trading CFDs at this site
You can then click the pencil icon to view all of the forex indicators available. After you have done your analysis, you can click the Trade icon to fill out your trading ticket.
Conclusion
Having access to a top-quality forex broker is essential when using technical forex indicators. After all, the indicators are analysing the price of the market so you want to make sure your broker is regulated and offers good liquidity.
eToro fits the bill and comes with some unique additional features. It is the largest copy trading platform in the world so you can follow other profitable traders or get paid when they follow you.
The web platform is super simple to use and there are a ton of technical forex indicators for you to use on its more than 2,400+ market range.
eToro – Best Forex Broker for Indicators
![]()
67% of retail investor accounts lose money when trading CFDs with this provider.
FAQs
What are the best indicators for forex trading?
How to use forex indicators?
What are the best indicators for when to buy and sell forex?
What are the best forex indicators for scalping?
What are the best exit indicators?