There’s been loads of talk this week about the correlation between stocks and the dollar thanks to an article in the Wall Street Journal and the reactions to it from folks on CNBC and in the blogosphere. The driving idea is that the relationship has broken down of late. Is that really the case? Well, let’s take a look at a comparative chart.
Guest post by John Forman.
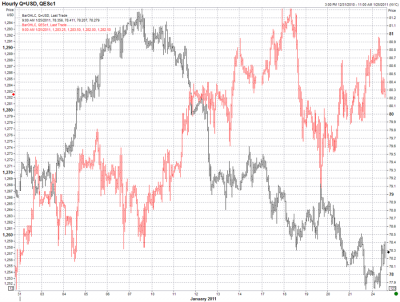
The graph below shows how stocks and the dollar have traded through the month of January. The red line is the stock market as measured by the mini S&P 500 futures. The black line is the cash Dollar Index.

So what’s the conclusion? At times the markets definitely show a strong negative correlation. The period between January 10th and January 18thshow two markets almost totally going in opposite directions. The two markets were positively correlated during the earlier part of the month, however, and since the 18th things have been rather muddled. The point is correlations change, even from day to day at times.
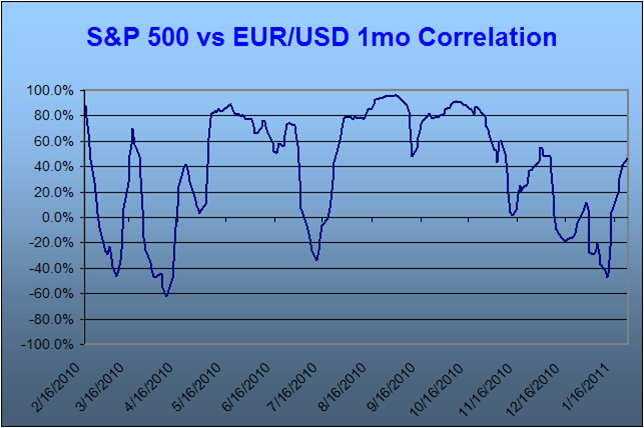
And change is the key. The chart below goes back a year and plots the 1-month trailing correlation between the S&P 500 index and the EUR/USD rate (the latter being the major element to the Dollar Index). When EUR/USD is rising it means a weaker dollar, so a strong positive correlation means stocks and the buck are moving in opposite directions.
Notice how much variability there’s been in the correlation just in the last year. Certainly, most of the time stocks and the dollar have moved in opposite directions (positive correlation on the above chart), including of late. That wasn’t always a strong correlation, though, and at several points the correlation was negative, indicating stocks and the dollar moving in the same direction.
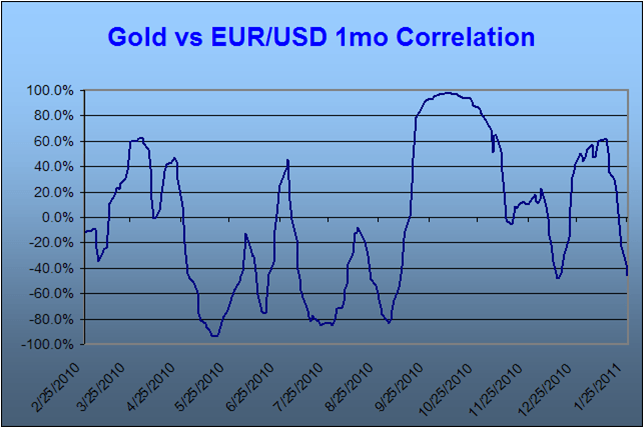
Then there’s the relationship between gold and the dollar, which hasn’t been nearly as consistent as the one between stocks and the dollar. The chart below shows the last year worth of trailing 1-month correlations between the metal and the greenback.
Again, here we have EUR/USD as a kind of reverse proxy for the Dollar Index. If gold and the dollar consistently trade in opposite directions we would expect to see a consistent strong positive correlation between gold and EUR/USD. That clearly has not been the case, however. Most of the time, in fact, the relationship has been the other way around – gold and the dollar generally moving in the same direction.
The changes in correlations between markets reflect changes in the primary moving force underlying those markets. Stocks and the dollar have moved in opposing directions thanks to risk on/off psychology in the past. That’s less the case now, which is why the arguments are being made about the negative correlation breaking down. There are other things, however, which can cause that inverse relationship to continue. One of those is relatively low interest rates in the US pressuring the greenback, but at the same time benefiting stocks.
Likewise, gold and the dollar have traded in the same direction at times of risk-on/off because investor money flows into dollar and into gold when there’s a lot of fear in the market. The two markets trade in opposite directions when the market is more fixated on the negative impact of something like quantitative easing on the dollar (higher money supply reduces the value of the dollar in terms of real assets).
The point is, just because one set of causes for markets being correlated or uncorrelated are no longer the major driving force, it doesn’t mean that there isn’t another set of causes that can maintain the same or similar linkage.
=====
Be sure to read the full risk disclosure before trading Forex. Please note that Forex trading involves significant risk of loss. It is not suitable for all investors and you should make sure you understand the risks involved before trading. Performance, strategies and charts shown are not necessarily predictive of any particular result. And, as always, past performance is no indication of future results.
=====
John Forman is a senior foreign exchange analyst for the IFR Markets group of Thomson Reuters and author of “The Essentials of Trading.” John is a 20+ year veteran of the financial markets. He holds an MBA from the University of Maryland and a BS from the University of Rhode Island, both concentrating in finance.


