Norway has an effectively managed and efficient export economy. Norway ranks third in natural gas exports and 7th in oil exports. Norway’s oil production company, Statoil, is 70% state owned and provides the country with 30% of total export revenues. Nearly 100% of Norway’s internal power consumption is satisfied by renewable resources: over 98% from hydroelectric, the rest from wind and thermal.
Aside from oil, Norway’s mineral exports include industrial metals, most notably iron ore and copper. Norway trades mostly with the Eurozone; 26% of exports are to the U.K. Aside from Europe, 9% of imports are from China. Norway is not an EU member although it is a contributor to the EU’s budget. Overall, Norway’s economy is surprisingly small at USD $339 billion PPP-GDP. Per capita PPP-GDP is nearly USD $67,000. Household consumption is 41% of GDP and the gross national savings rate is nearly 37% of GDP.
Guest post by Mike Scrive of Accendo Markets
The mandate of Norges Bank is “price and financial stability, and to generate added value through investment“. By far and away Norges Bank has been successful in this aim. Norges Bank’s investments have created the largest sovereign wealth fund and supports Norway’s comprehensive social services network. Norway’s sovereign bonds earn the highest ratings. Per capita PPP-GDP is nearly USD $67,000. Household consumption is 41% of GDP and the gross national savings rate is nearly 37% of GDP. It should be noted that Norges Bank’s investments go well beyond sovereign bonds. For example, in mid-April Norges Bank’s acquired a 45% interest in a joint venture with Prologis, an industrial REIT.
The ‘key rate’ was stepped down from 5.75% in September 2008 to 1.25% over a 12 months period. In October of 2009 Norges Bank began to increase rates over the next 22 months to 2.25%. From November 2011 the bank reversed policy again notching down to 1.25%. The next policy meeting and announcement will take place on 7 May. According to the Norway’s data collection agency, Statistics Norway, 2015 oil sector revenues will decline by almost 16%, which is higher than anticipated. Annualized GDP is forecast at 1.1%. In order to increase consumer spending Norges Bank is expected to cut rates twice to 0.75% from 1.25%.
The important points are that Norway’s exports include strategic commodities for which demand is slowing and for which there is oversupply. Norway depends on export revenues to fund a large public sector. Although export revenues may decline, the very prudent Norge Bank is well positioned. Also, Norway’s ability to weather a global slowdown may be found in individual household wealth, energy independence and a strong public social services network. Further, lower mortgage lending rates are expected to add to consumer purchasing power.
It is not unreasonable to assume that in spite of declining revenues, Norway may be considered a ‘safe haven’ for capital searching for yield or safety. Hence it is not unreasonable to expect increasing demand for the Norwegian Krone.
| GBP/NOK | Price Location | Span A | Span B | Tenkan vs Kijun | Sentiment |
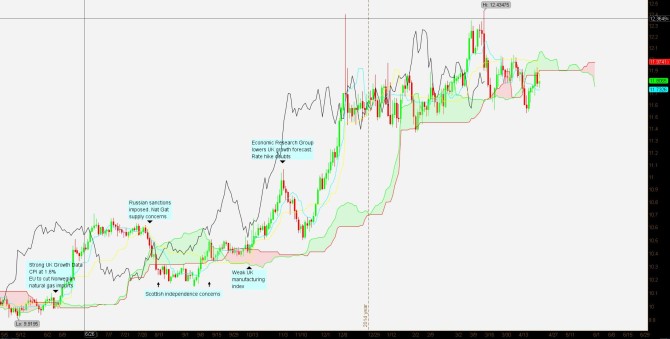
| Trend Indeterminate | Inside Cloud | Resistance at 11.97 | Below Span A | Crossover Slightly Bullish | Neutral |
The U.K. has a far larger and more complicated economy. Just a few points for comparison: GDP USD $2.853 trillion, 2015 expected annualized growth of 3.0% and 2014 GDP recently revised up to 2.8% from 2.6%. Per-capita GDP is USD $46,244. The U.K. is an EU member state and it trades mostly with Europe. Aside from Europe, the US accounts for 10.5% of exports and China accounts for 8% of imports.
However, in a bit of a conundrum, inflation is spot on 0.0% and is expected to drop below 0.0% this year although some analysts dismiss the measure as a reflection of lower fuel and food prices. Also of concern is that of a growing current account deficit; i.e., the value of imports is exceeding the value of exports at a record setting pace. Simply put if consumer demand is strong, wages flat, inflation is nil and factory output being well short of capacity, the implication is that growth is not entirely organic. It’s not unreasonable to say that the U.K. is importing deflation from the continent and consumers are taking advantage of it.
A few key events are noted on the chart. The Pound Sterling has erratically strengthened over a 52 week period. The low, 9.9195 Kr per GBP occurred in May of 2014. The high, 12.43475 Kr per GBP occurred mid-March of 2015. The EU announced an energy independence initiative, but those plans were scrapped as the Ukraine crisis worsened and sanctions were imposed on Europe’s main natural gas supplier, Russia. Norway exports over 100 billion cubic meters of natural gas to Europe. An increase natural gas demand would strengthen Norway’s economy. As it stands now, Europe cannot risk reducing gas imports from Norway until the Ukraine crises is settled.
Under the reasonable assumption that the Norwegian economy is able to remain stable while European growth is slowing, then GBP/NOK is more of a function of the GBP. The assumption is a fair one considering Europe’s demand for natural gas. A slower or stagnant U.K. economy would imply a weaker Pound Sterling and steady natural gas demand would imply, at the very least, a stable Krone. Further, Krone stability may result from the strategic investment choices of Norges Bank and also as a safe haven for foreign capital. GBP/NOK is just off its 52 week high and the Ichimoku chart indicates no clear direction. In conclusion, the greater risk seems being long GBP/NOK.
“CFDs, spread betting and FX can result in losses exceeding your initial deposit. They are not suitable for everyone, so please ensure you understand the risks. Seek independent financial advice if necessary. Nothing in this article should be considered a personal recommendation. It does not account for your personal circumstances or appetite for risk.”

