Trading news reports can be extremely profitable or extremely risky and to trade the news a trader must have an immense level of emotional control. Fear and greed are the two main emotions a trader must control whilst making any trading decision but in particular when trading a news report. This is because during an important news report the price of an asset can move fast and sometimes erratically. Fear can either make a trader hesitate and not enter a good opportunity, or stay in a losing trade hoping their fortunes will change instead of cutting short their losses. Greed will compel a trader not to exit a trade either fully or partially when the trend has clearly changed and in worst case scenarios a big winning trade can turn into a big losing trade. Greed also can drive a trader to over-trade and enter trades when there are no signals for a good opportunity. Learning to control these emotions is an ongoing process which I’m sure even the greatest veteran traders will have to deal with from time to time.
The method I’m going to bring to your attention is one of many ways a trader can trade the news. This is a method I have developed through practice and trial and error and plenty of research. However, I don’t claim ownership on the concepts I will mention in this method. But I like this method because it utilises support and resistance levels and I’m a big fan of those. Support and resistance levels are a simple concept to grasp but are used by many traders all across the global.
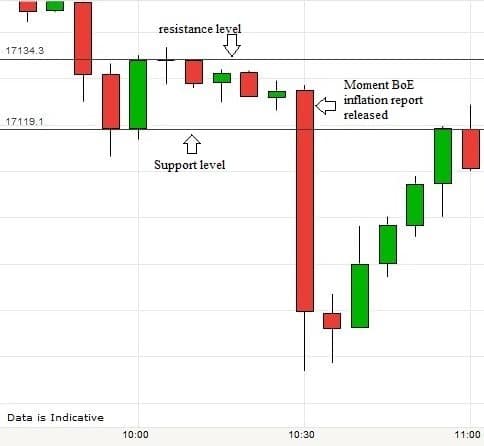
The news report I shall use as an example so we can visualise the method is the Bank of England Inflation Report of Wednesday, 14 May 2014 at 10:30am GMT. Some news trading methods rely on entering trades as soon as news is released but immediately following the release of news movement of price can be extremely unpredictable.
One of my personal favourite forex pairs to trade is the GBP/JPY because if we trade it well we can make a lot of pips as this pair can make big moves. Before a news report is released we need to set our chart to the 5 minute timeframe and draw out one support line and one resistance line on our chart which will then give us a channel. We only need to draw the levels which are most recent at this particular time. This shouldn’t be too difficult because usually before an important news report is released the price will move in a narrow range. If we have trouble drawing support and resistance levels then we will need to do some research into how to construct them. I hope to write an article sometime in the future that will help to explain the theory of support and resistance levels in order to provide a better understanding of these.
After we have constructed a channel from the most recent support and resistant levels we need to wait until the report is released and then determine if the result is going to have a negative or positive effect on the currency in question. In this case it will be the effect the BoE Inflation Report has on the GBP. Reports can be delivered in the format of either a Press Conference by the Head Banker or document reports. Sometimes a figure is all that is needed for example the release of the unemployment rate news report. In the case when the report just consists of a figure it is much easier to decide whether it is going to have either a negative or positive effect. If the report is worse than expected then it usually will have negative effect on the currency in question and vice versa.
In our case when the report is delivered, investors over the world would either have to listen to or read the statements to try to decipher the message and determine whether it is either more hawkish or dovish. This can be difficult especially because the statements are never in plain general English. However, we can read or listen to live news feeds by economists who will give their opinion on the reports whether dovish or hawkish. From the chart below we can see that the report was dovish as the price of the GBP/JPY fell sharply once the report was delivered. Also note the support and resistance levels which I drew on the charts confirming that the price broke through the support level.
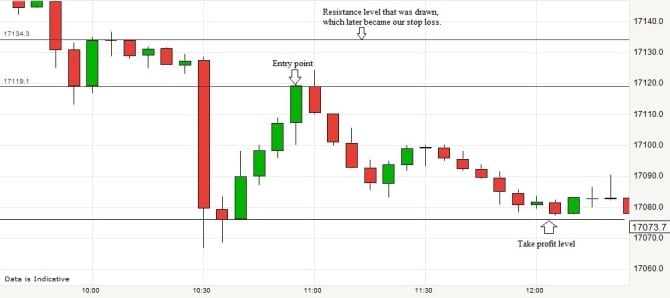
The next stage of the trade would be to wait until the price retraces near to the broken level. When the price finally touches the broken level we will enter a trade in the original direction. In this case the original direction of the trade was short because it broke the support line before retracing, so we should enter a short trade but make sure our position sizing is correct.
Our stop loss would need to be set just about the resistance line we drew before and we should take the profit at what would have been at the lowest point before the price retraced. On this trade we risked about 15 pips for a potential reward of 60 pips. This would have given us a reward: risk ratio of 4:1 which is great.
I personally like to ride my trades as long as possible and I would have closed out about 50% of my positions at the lowest point and then move my stop loss to the entry level, and then ride the move and adjust my stop loss and position size accordingly as it continues. However I will leave that for another time.
CFDs, spreadbetting and FX can result in losses exceeding your initial deposit. They are not suitable for everyone, so please ensure you understand the risks. Seek independent financial advice if necessary. Nothing in this article should be considered a personal recommendation. It does not account for your personal circumstances or appetite for risk.
Guest post by Piankhi De Jonge of Accendo Markets
Piankhi De Jonge has been currently trading the financial markets for around 3 years he mainly trades the forex market, and on occasion equities and commodities.
