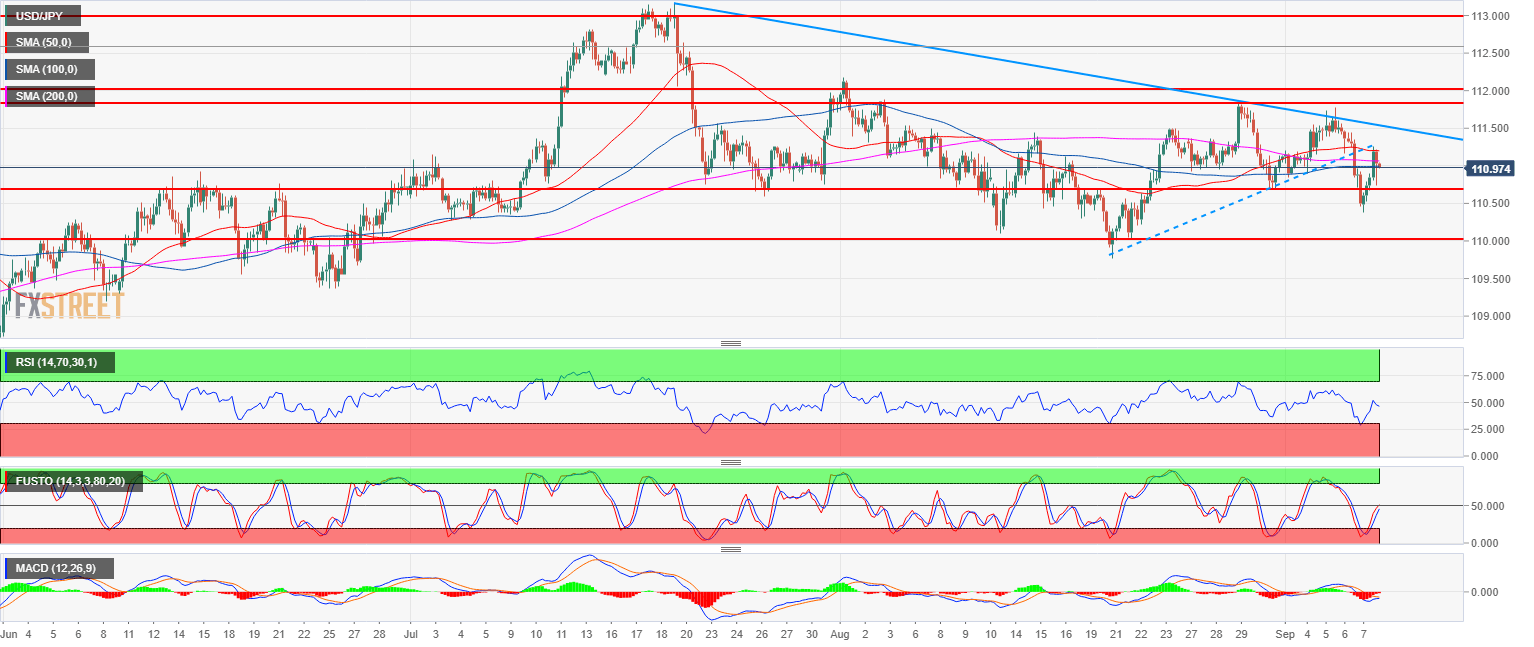
- USD/JPY bull trend is on hold as the market has been range bound since mid-July.
- USD/JPY is testing a bull trendline (dotted line) and the 50-period simple moving average (SMA) suggesting that the market might find some resistance at this level.
- Bulls would need a breakout above the bear trend line (blue line) and possibly above the 112.00 figure in order to confirm a bullish bias while for the bears 110.00 seems to be the line-in-the-sand. Until there is a clear directional bias, more ranges are to be expected on USD/JPY.
Spot rate: 110.98
Relative change: 0.20%
High: 111.26
Low: 110.38
Main trend: Bullish
Short-term trend: Neutral
Resistance 1: 111.00 figure
Resistance 2: 111.45 August 8 high
Resistance 3: 111.54 August 6, high
Resistance 4: 111.84 August 29 swing high
Resistance 5: 112.00-112.15 zone, figure and August 1, swing high
Resistance 6: 112.40 supply level
Resistance 7: 113.18, 2018 high
Support 1: 110.75, July 23 swing low
Support 2: 110.00 figure
Support 3: 109.37 June 25 low
