- Gold has established a lower highs pattern, as seen in the hourly chart below, and a break below $1,189 (Sep. 4 low) would establish a lower pattern and open the doors to re-test of Aug. 18 low) and $1,160 (Aug. 16 low).
- A break below the immediate support at $1,189 looks likely as the USD, gold’s biggest nemesis, could remain better bid today as data released on Friday showed the US wage growth figure rose at the quickest pace since 2009.
- Further, the downward sloping 5-week and 10-week moving averages (MAs) indicate a bearish setup.
- On the higher side, only a daily close above $1,207 (Sep. 6 high) could embolden the bulls.
Hourly Chart
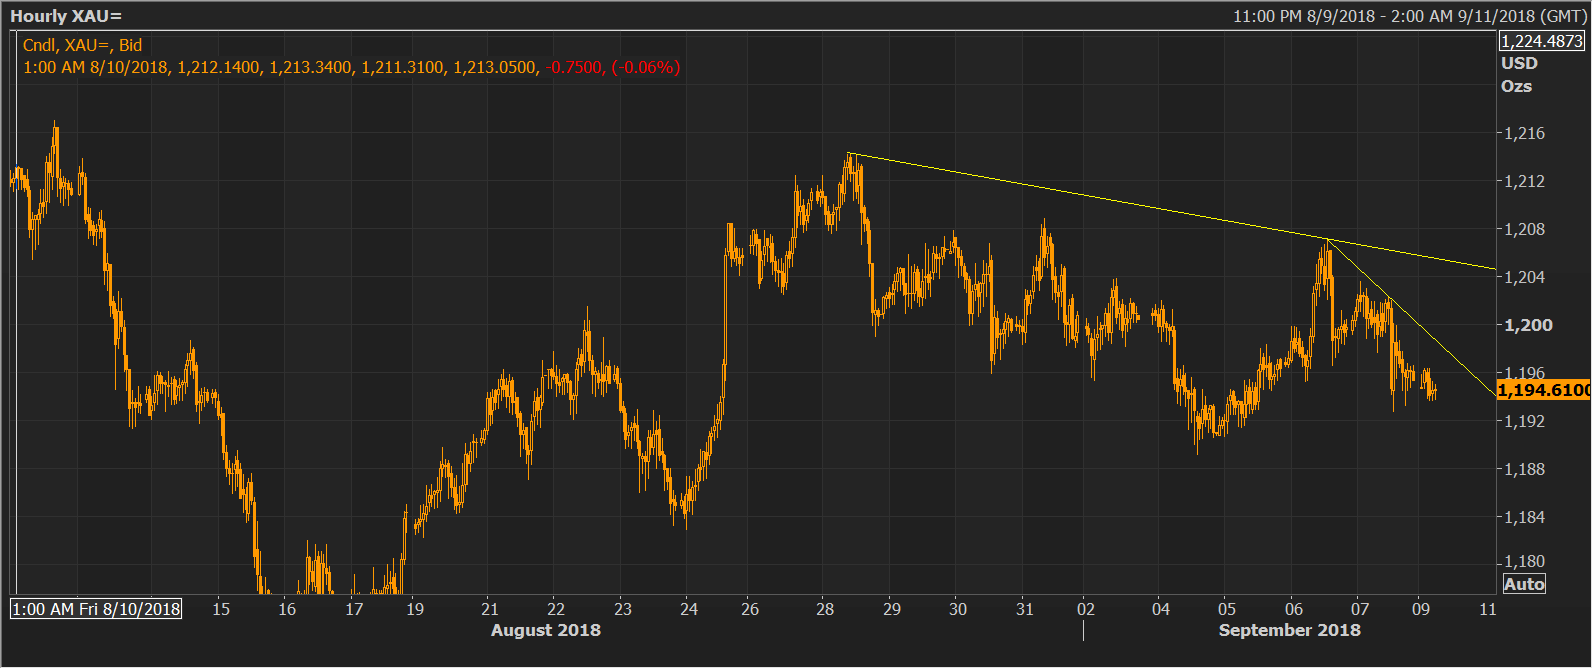
Current Price: $1,194
Daily High: $1,196
Daily Low: $1,194
Trend: Bearish
R1: $1,200 (psychological hurdle)
R2: $1,207 (Sep. 6 high)
R3: $1,215 (50-day moving average)
Support
S1: $1,189 (Sep. 4 low)
S2: $1,183 (Aug. 24 low)
S3: $1,180 (61.8% Fib R of $1,160/$1,207)
