- USD/CAD main bull trend is taking a breather as the market is having a hard time to break above 1.3200 figure.
- USD/CAD is losing bullish momentum as the RSI, MACD and Stochastics indicator are flashing bearish signals.
- The short-term bear target can be located near 1.3048 (August 14 low) near the 100 and 200-period simple moving averages and the bear trendline (blue).
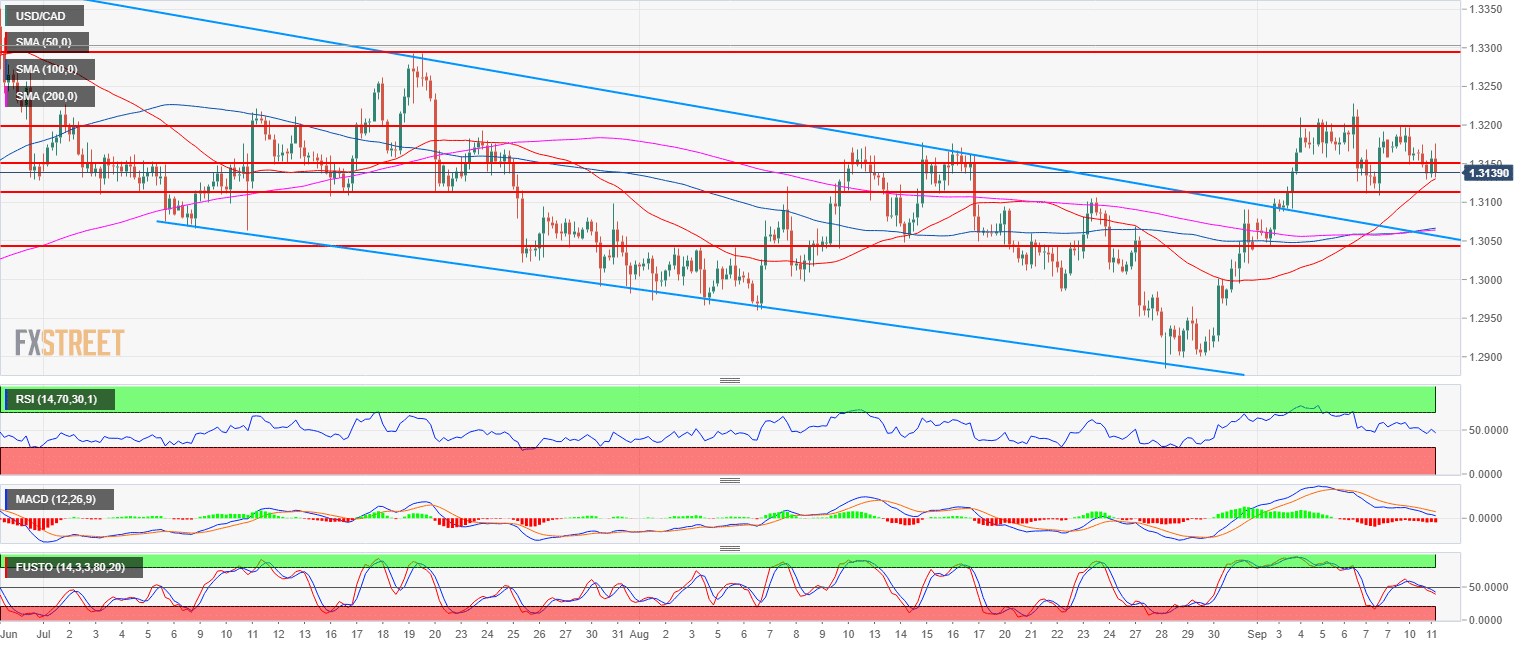
Spot rate: 1.3138
Relative change: -0.21%
High: 1.3176
Low: 1.3129
Trend: Bullish
Short-term: Bearish below 1.3200
Resistance 1: 1.3155 June 18 low
Resistance 2: 1.3172 August 13 swing high
Resistance 3: 1.3200 figure
Resistance 4: 1.3300 figure
Resistance 5: 1.3388, 2018 high
Support 1: 1.3108, September 7 low
Support 2: 1.3048 August 14 low
Support 3: 1.3000 figure
