- GBP/JPY main trend has essentially been sideways in 2018.
- GBP/JPY is trading above its 50, 100 and 200-period simple moving averages as the bulls are attempting to break above 147.15 (August 1 swing high). The next objectives to the upside are 148.00 figure and 149.32 July 16 swing high.
- However, a failed breakout above 147.15 can lead to a retest of 146.30 and 145.00 figure.
GBP/JPY 4-hour chart
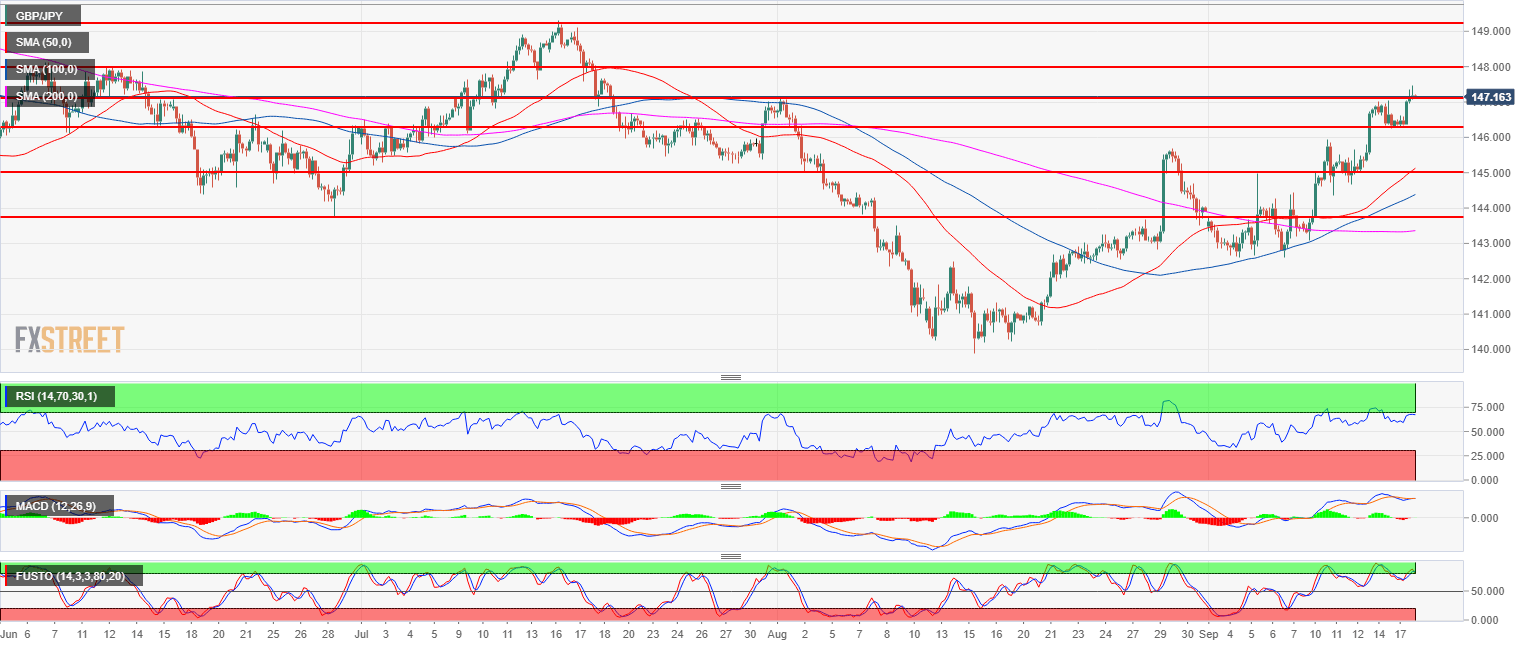
Spot rate: 147.14
Relative change: 0.46%
High: 147.46
Low: 146.31
Main trend: Sideways
Short-term trend: Bullish
Resistance 1: 147.15 August 1 swing high
Resistance 2: 148.00 figure
Resistance 3: 149.32 July 16 swing high
Support 1: 146.30 September 14 low
Support 2: 145.00 figure
Support 3: 143.77 June 28 swing low
