- The GBP/JPY pair is popping to test the 148.00 key barrier early on Wednesday after headlines broke that the UK and the EU may be much closer to achieving a workable trade deal than previously thought.
- Overbought readings are beginning to show on intraday indicators, implying the bullish push may face some downward pressure before the trend can resume.
- Wednesday will also be seeing inflation data for the UK at 08:30 GMT, and GBP traders should be braced for a bearish turnaround if the numbers fail to meet expectations.
GBP/JPY Chart, 15-Minute
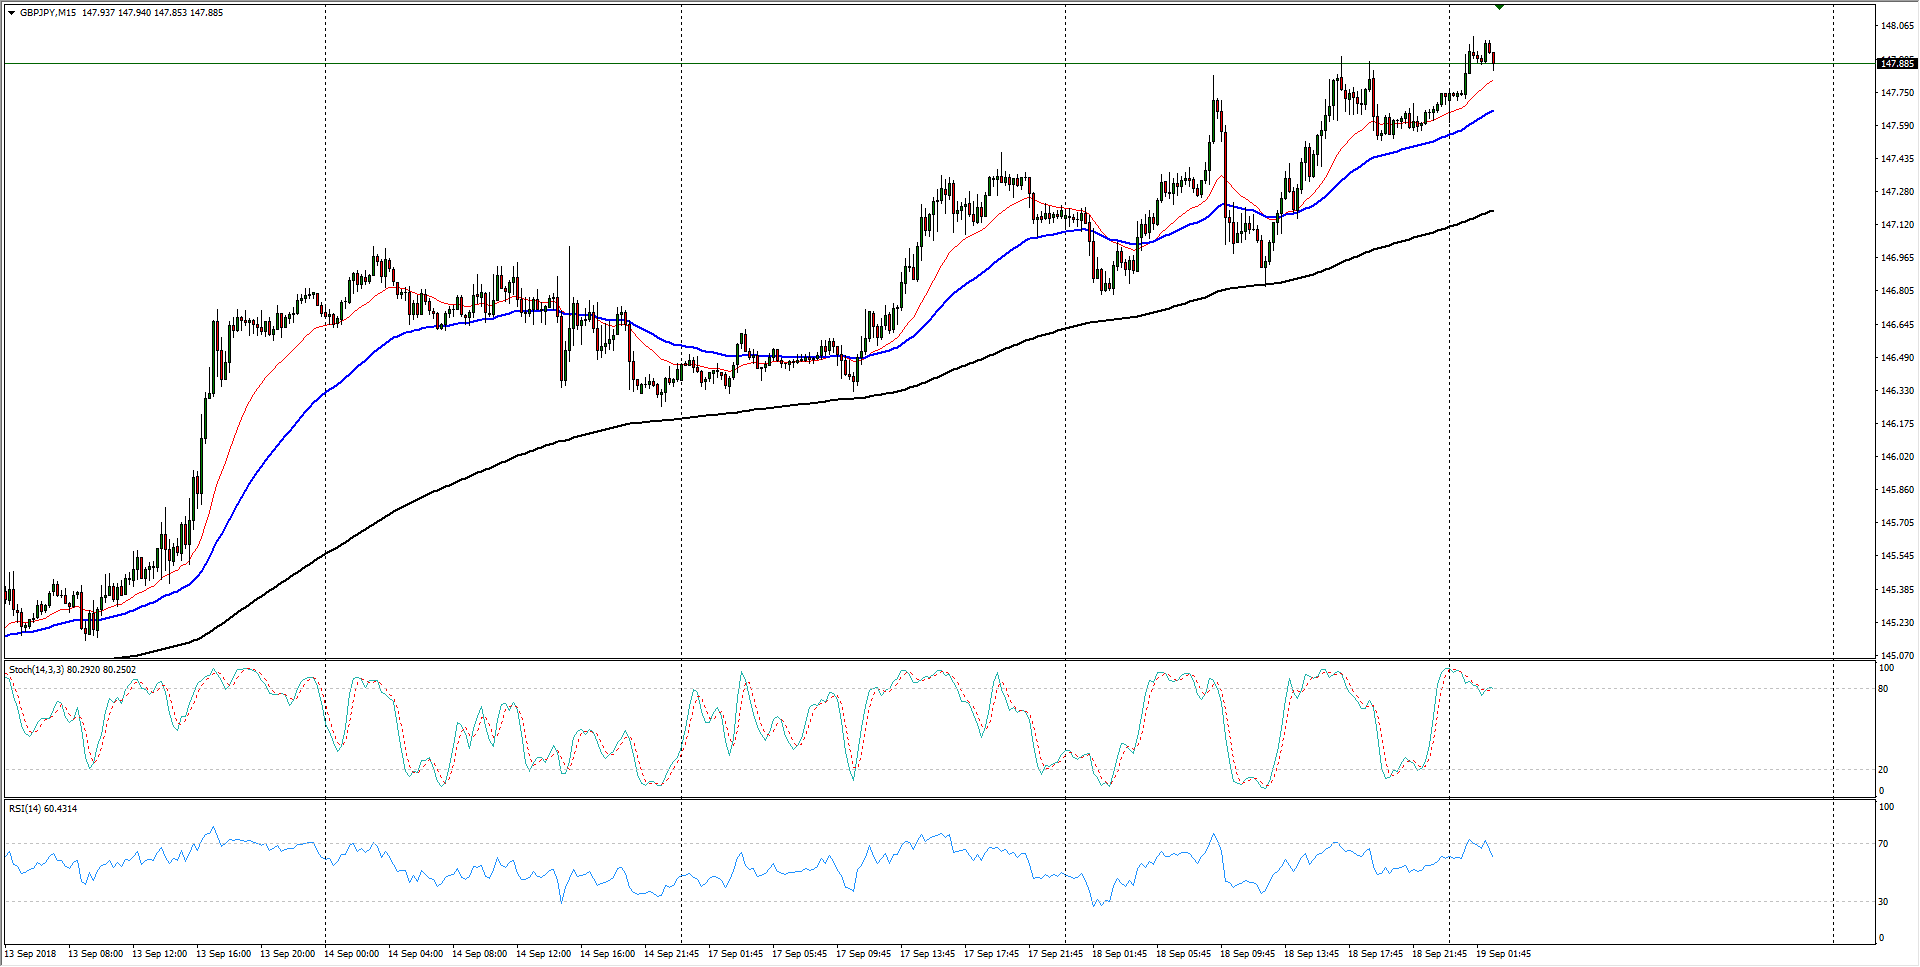
| Spot rate | 147.88 |
| Relative change | 0.11% |
| High | 148.01 |
| Low | 147.60 |
| Trend | Bullish |
| Support 1 | 147.20 (50-hour EMA) |
| Support 2 | 146.32 (current week low) |
| Support 3 | 145.84 (200-hour EMA) |
| Resistance 1 | 148.00 (major technical level) |
| Resistance 2 | 149.31 (July swing high) |
| Resistance 3 | 150.00 (major technical level; May swing high) |
