- USD/JPY bulls want to extend the bull trend as they are challenging the July high.
- The 50, 100 and 200-period simple moving average on the 4-hour time frame are rising and widening suggesting a bullish momentum. However, counter-trend traders are currently preventing the market to break above 113.18 July high. A clear breakout above the level would open the door to 114.00 figure and 114.80 (November 2017 high).
- However, in the absence of a sustained breakout above 113.18, bears have a fair chance to drive the market down near 112.00 figure.
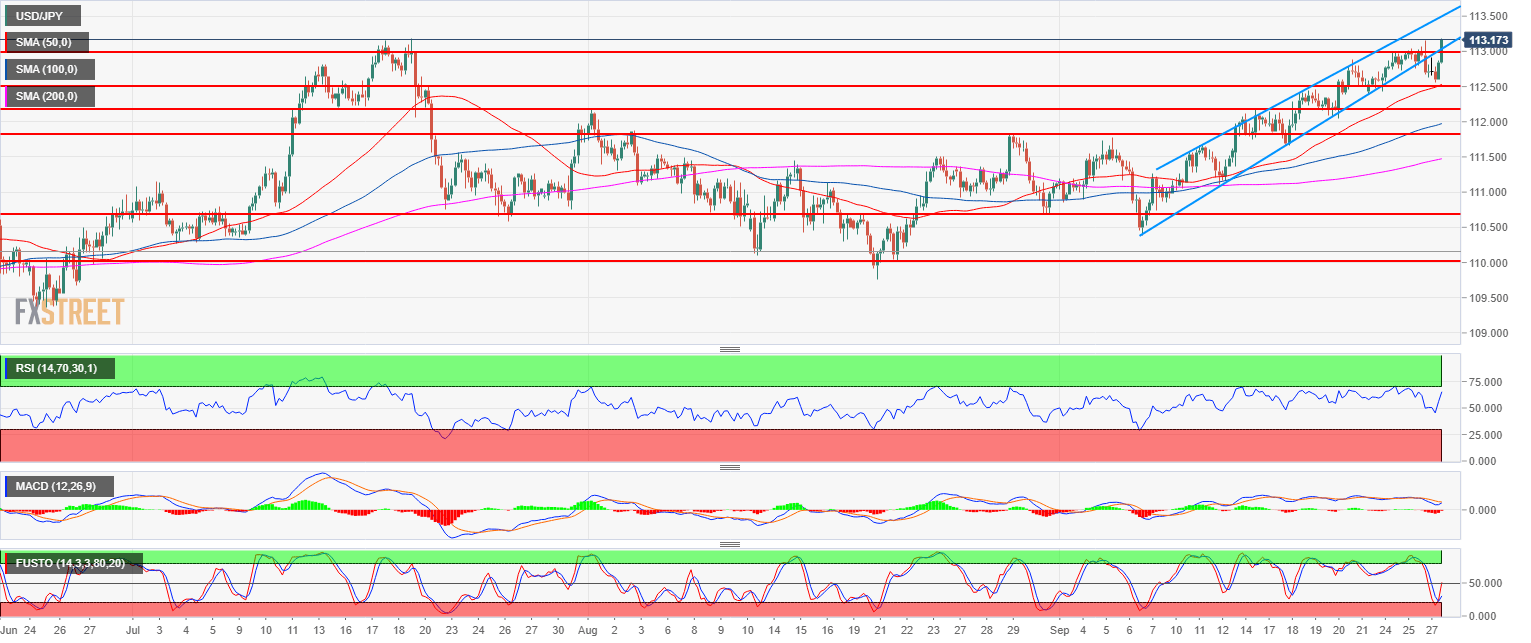
Spot rate: 113.16
Relative change: 0.39%
High: 113.21
Low: 112.55
Main trend: Bullish
Short-term trend: Bearish reversal risk below 113.18
Resistance 1: 113.18, July high
Resistance 2: 114.00 figure
Resistance 3: 114.80 November 2017 high
Support 1: 112.50 figure
Support 2: 112.00-112.17 zone, figure and August 1, swing high
Support 3: 111.84 August 29 swing high
Support 4: 111.84 August 29 swing high
Support 5: 111.54 August 6, high
Support 6: 111.45 August 8 high
Support 7: 111.00 figure
Support 8: 110.75, July 23 swing low
Support 9: 110.00 figure
Support 10: 109.37 June 25 low
