- Gold bears are at work resuming the main bear trend.
- Gold is currently testing $1,182.90 (August 24 low) as the RSI, MACD and Stochastics indicators are weakening, suggesting that further losses below the level can be around the corner. A sustained break below 1,182.90 would open the door for 1,172.82 (current 2018 low) and 1,145.20 (March, 1 2017 low).
- However, a bull breakout above 1,204.10 (August 3 swing low, key level) would likely invalidate the current bearish momentum
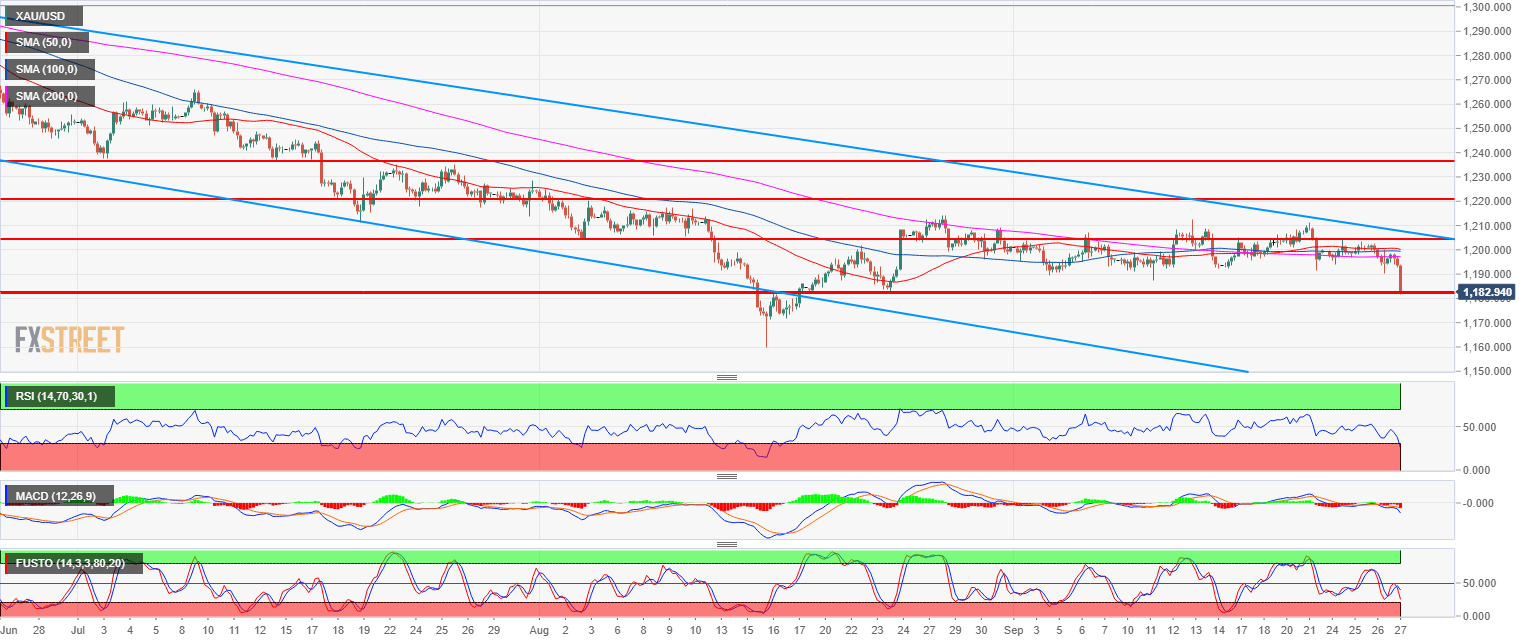
Spot rate: 1,182.91
Relative change: -0.95%
High: 1,198.63
Low: 1,181.72
Main trend: Bearish
Resistance 1: 1,189.49 September 4 low
Resistance 2: 1,194.30 March 10, 2017 low
Resistance 3: 1,204.10, August 3 swing low (key level)
Resistance 4: 1,211.17 July 19 low
Resistance 5: 1,214.30 August 28 high
Resistance 6: 1,217.89-1,220.90 zone, August 6 high and July 18 low
Resistance 7: 1,225.90 July 17 low
Resistance 8: 1,237.60 July 3 swing low
Support 1: 1,182.90 August 24 low
Support 2: 1,172.82 current 2018 low
Support 3: 1,145.20 March, 1 2017 low
