“¢ The pair, over the past 1-1/2 week or so, has been drifting lower, but finding decent support at a downward sloping trend-line on the 1-hourly chart.
“¢ Barring a few knee-jerk spikes, the corrective bounces have failed to lift the pair beyond an important confluence hurdle, comprising of 50-hour SMA and another descending trend-line.
“¢ Meanwhile, technical indicators on the mentioned chart have started recovering from the negative territory and seemed to support prospects for a fresh attempt towards clearing the said barrier.
“¢ However, a convincing break below the lower trend-line support will point to a fresh bearish breakdown and pave the way for an extension of the pair’s near-term bearish trajectory.
NZD/USD 1-hourly chart
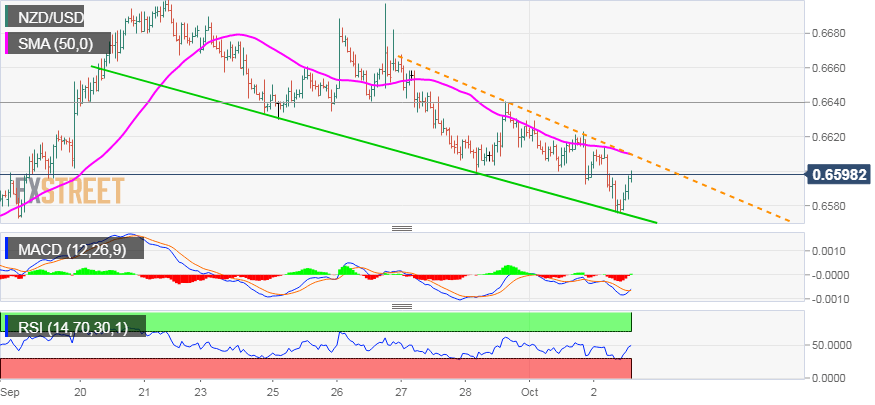
Spot Rate: 0.6598
Daily High: 0.6615
Daily Low: 0.6575
Trend: Intraday bullish until holds above trend-line support
Resistance
R1: 0.6610 (50-period SMA H1)
R2: 0.6629 (overnight swing high)
R3: 0.6645 (R2 daily pivot-point)
Support
S1: 0.6575 (current day swing low)
S2: 0.6540 (horizontal zone)
S3: 0.6524 (recent daily closing low)
