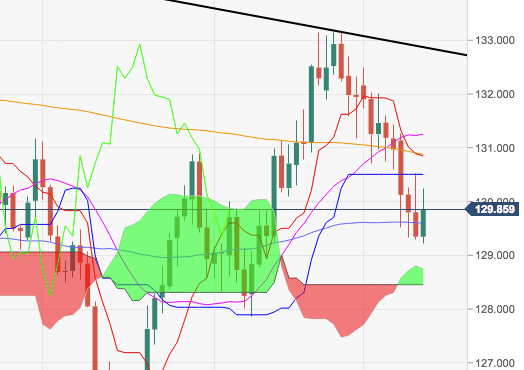
- After five consecutive daily retracements, EUR/JPY met some dip-buyers in the vicinity of the 129.00 handle, coincident with the 100-day SMA.
- Further recovery should face the next relevant target at the 200-day SMA at 130.85 ahead of the 21-day SMA at 131.25.
- The downside bias is poised to persist, however, as long as the resistance line at 132.87 caps.
EUR/JPY daily chart
EUR/JPY
Overview:
Last Price: 129.91
Daily change: 56 pips
Daily change: 0.433%
Daily Open: 129.35
Trends:
Daily SMA20: 131.32
Daily SMA50: 129.56
Daily SMA100: 129.36
Daily SMA200: 130.93
Levels:
Daily High: 130.52
Daily Low: 129.29
Weekly High: 132.49
Weekly Low: 130.6
Monthly High: 133.15
Monthly Low: 127.87
Daily Fibonacci 38.2%: 129.76
Daily Fibonacci 61.8%: 130.06
Daily Pivot Point S1: 128.92
Daily Pivot Point S2: 128.49
Daily Pivot Point S3: 127.69
Daily Pivot Point R1: 130.15
Daily Pivot Point R2: 130.95
Daily Pivot Point R3: 131.38
